
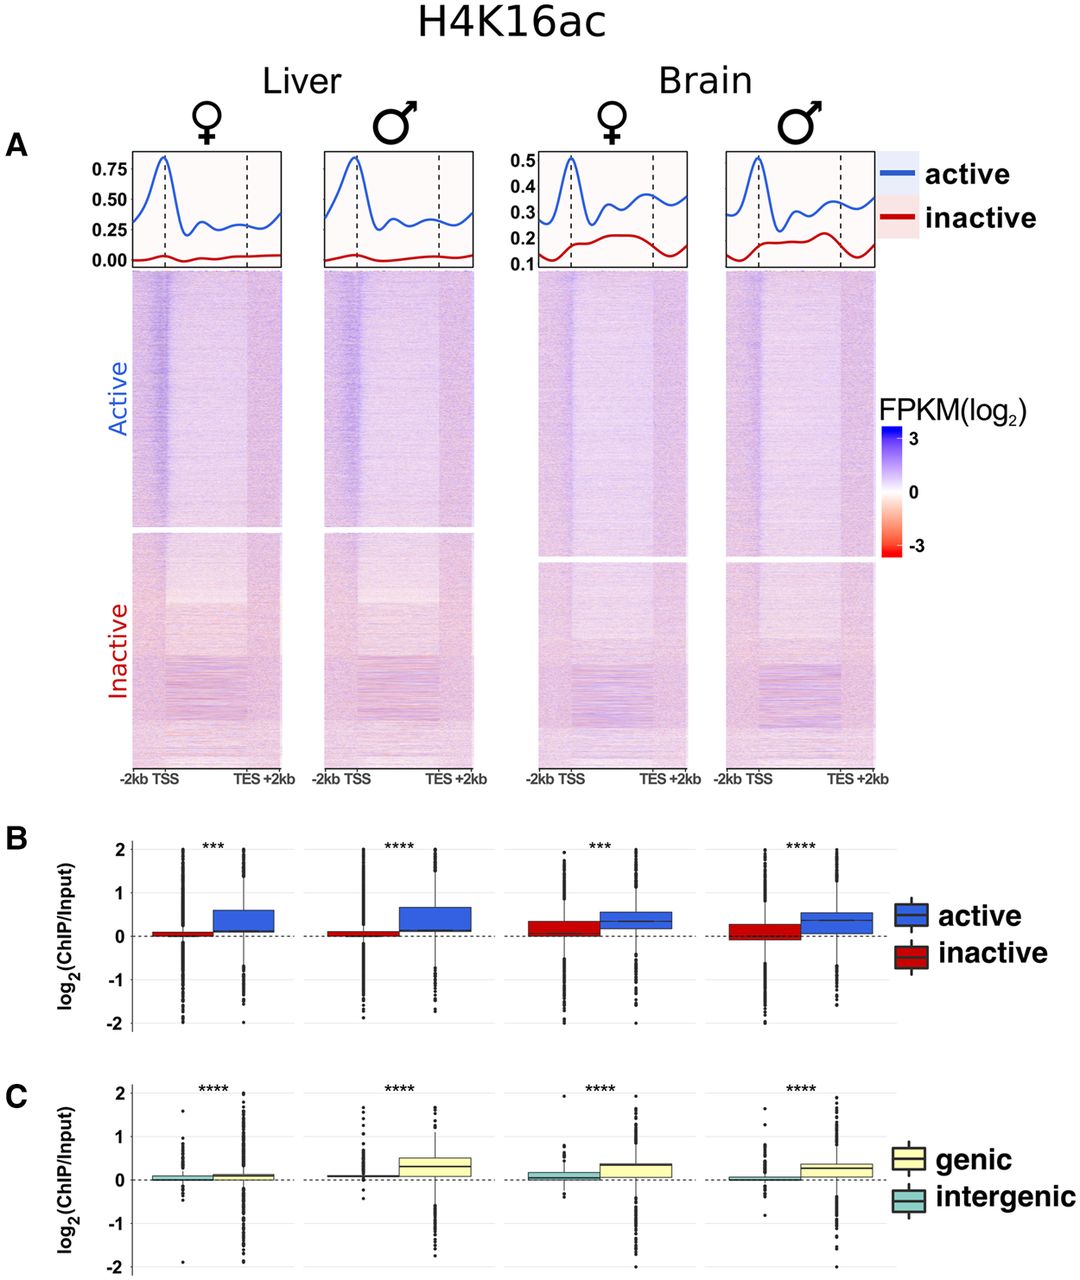
Features of H4K16ac in Anolis and its relationship with gene expression and genic regions. (A) Heat maps and average profiles showing input-normalized H4K16ac ChIP-seq (FPKM) signals for all Anolis genes sorted by gene expression values (FPKM) in decreasing order (top to bottom). The signal is particularly enriched along the gene body with peaks around TSS for active genes. The data illustrate the clear distinction between active and inactive genes (median curves) and the correlation between H4K16ac activity and gene expression, where ChIP-seq FPKM values tend to decrease with decreasing RNA-seq FPKM values (heat maps). The y-axis scale is the same for both sexes within each tissue. (B) Comparisons of H4K16ac signal distributions between active and inactive genes. (C) H4K16ac signal comparisons between genic and intergenic regions; genic regions include intervals between the TSS and transcription end site plus 2-kb regions upstream of the TSS. Supplemental Figure S11 contains similar plots for all samples. Active genes: FPKM ≥ 1, inactive genes: FPKM < 1. Statistical (Mann-Whitney U) test significance levels: (n.s.) not significant; (*) P ≤ 0.05; (**) P ≤ 0.01; (***) P ≤ 0.001; (****) P ≤ 10−10.


