
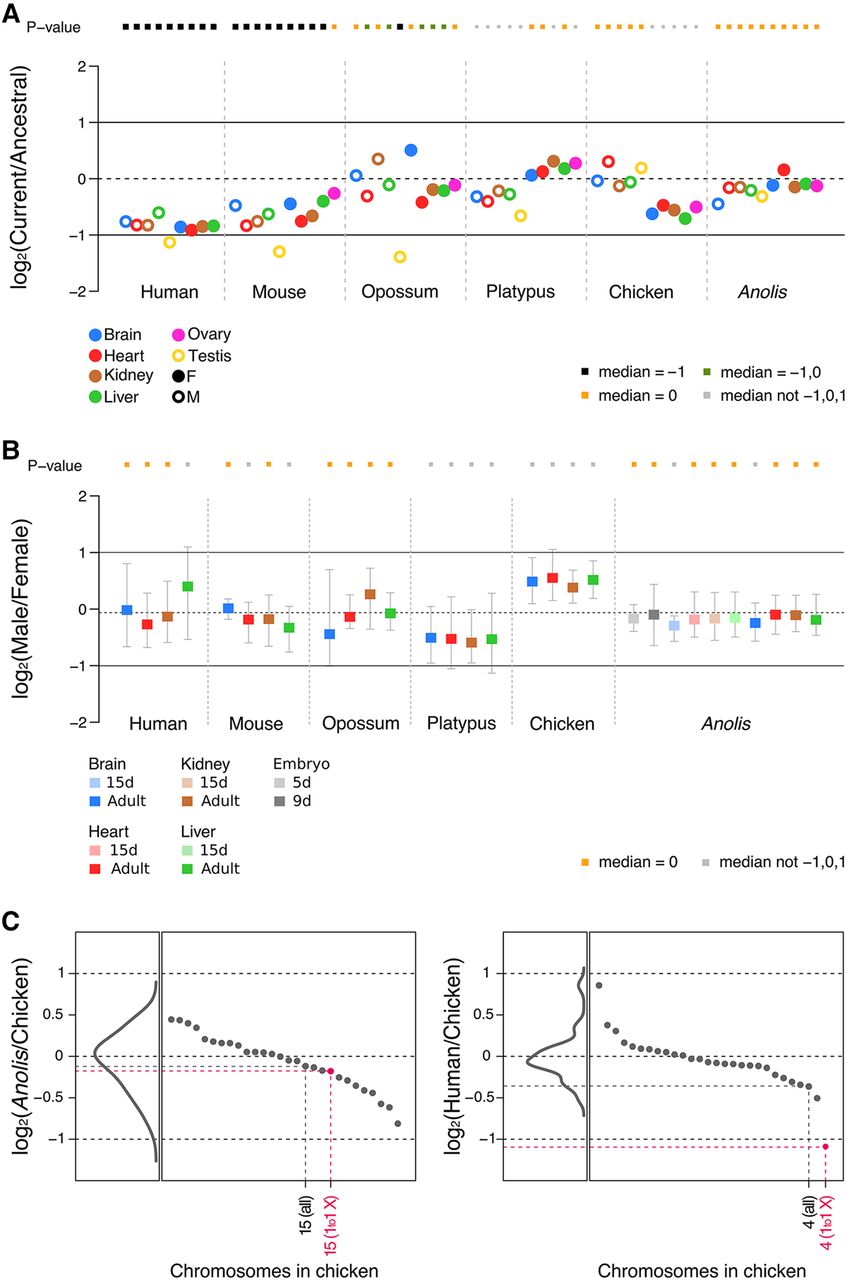
Expression level evolution of X-linked genes across amniotes. (A) Ratios of current expression levels of X-linked genes (median value) and their ancestral expression levels (median value) in four somatic tissues and gonads. Multiple outgroup species were used to calculate the ancestral expression levels (for therians: chicken, platypus, Anolis, Xenopus; for chicken/platypus: mouse, opossum, Anolis, Xenopus; for Anolis: mouse, opossum, chicken, platypus, Xenopus; note: human was not used as an outgroup anywhere, given that no ovary data were available). Full circles represent female tissues, whereas empty circles represent male tissues. Significant differences (Mann-Whitney U test): Benjamini-Hochberg-corrected P < 0.05 of current to ancestral ratios compared to reference values 1, 0, and −1. Orange squares indicate a current to ancestral ratio not significantly different from 0 (i.e., expression levels of X-linked genes have been preserved during evolution). Black squares indicate a current to ancestral ratio not significantly different from −1 but different from other reference values (i.e., expression levels decreased twofold during evolution). Green squares denote a current to ancestral ratio not different from −1 and 0, and gray squares indicate ratios different from −1, 0, and 1. For chicken, Z-linked genes were analyzed. We observe very similar patterns when using chicken or Xenopus as an outgroup (Supplemental Fig. S9). (B) Male to female expression level ratios in four somatic tissues and gonads across amniotes. Error bars indicate maximum and minimum values, excluding outliers. Tests of significance are analogous to those indicated for panel A. All underlying expression values are calculated as FPKM. (C) Median values (across the four somatic organs: brain, heart, liver, kidney) calculated from ratios of current expression levels of Anolis or human genes compared to current expression levels of 1:1 orthologous genes in chicken (the outgroup). Individual gene ratios were grouped following the chromosomal annotation in chicken and the median values for each chromosome are indicated and sorted in descending order (black and pink dots). Density diagrams represent the distribution of median values. In pink: median values for all genes in Chromosomes 4 and 15 of chicken (marked as “all”) and those with only 1:1 orthologous genes in the Anolis and human X Chromosomes (marked as “1to1 X”). Note that genes in chicken Chromosome 4 are only partially corresponding to human X-linked genes, while genes in the Anolis X almost entirely correspond to orthologs in chicken Chromosome 15. See Supplemental Figure S8 for the complete list of used autosomes.


