
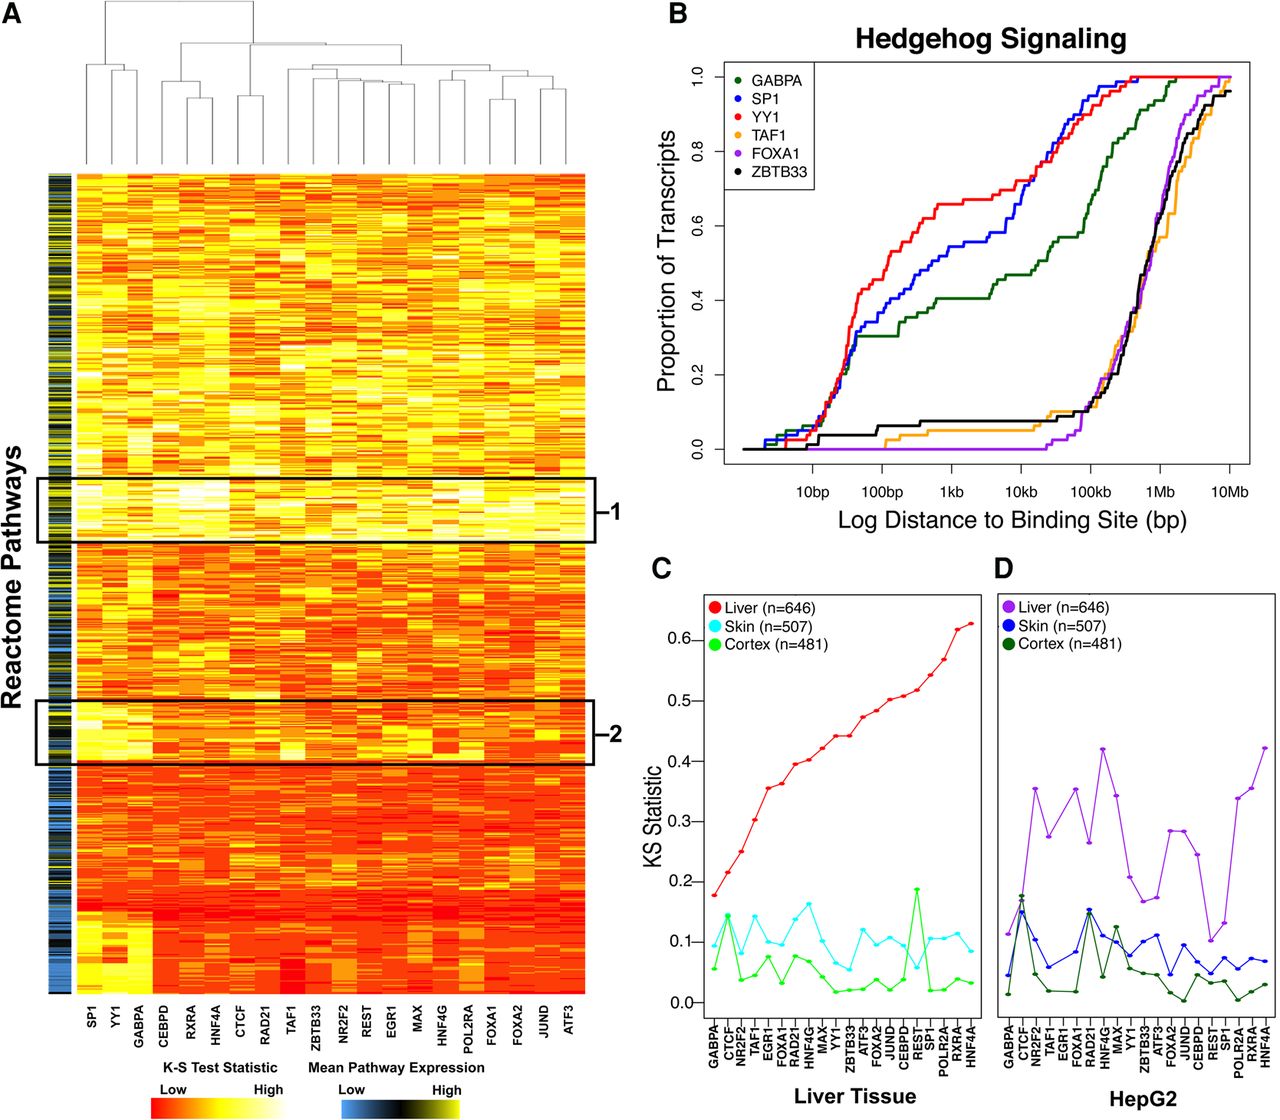
Primary liver tissue data recapitulate liver expression programs. (A) Heatmap of KS-test statistic indicating the level of enrichment for proximal binding to each Reactome pathway for each DAP. The color bar on the left indicates the mean expression level of genes within a pathway. Boxed regions indicate core liver pathways bound by all DAPs (1) or DAP-specific pathways involved in cell division and differentiation (2). (B) Representative private pathway plot demonstrating enrichment for proximal GABPA (green), SP1 (blue), and YY1 (red) binding compared to TAF1 (orange), FOXA1 (purple), and ZBTB33 (black). (C,D) Dots represent KS-test statistic of enrichment for proximal binding of each factor to liver (red/purple), skin (blue), and cortex (green)-specific genes in adult/male tissue (C) and HepG2 cells (D).


