
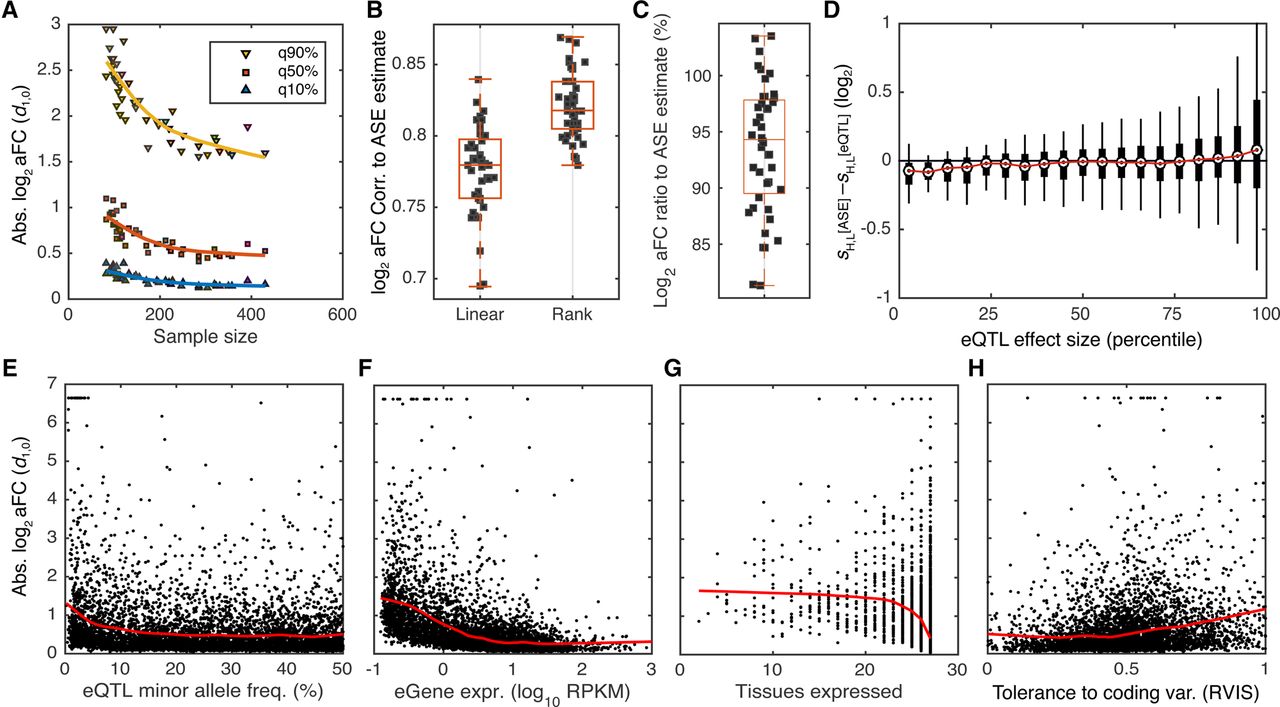
Empirical properties of the aFC distributions in GTEx data. All aFC values are calculated with the nonlinear approximation method (M3). (A) Distribution of absolute log2 aFC across tissues as a function of sample size. Each point represents a tissue in GTEx data, and 90%, 50%, and 10% quantiles of absolute aFC across a tissue are shown. (B,C) Correlation of log2 aFC estimates (B), and the ratio of the estimates (C) derived from eQTL and ASE data. Each point corresponds to one GTEx tissue. (D) Difference between the aFC estimates from allelic expression (sASE) and eQTL (seQTL) as a function of absolute average aFC (|sASE+ seQTL|/2), with H and L referring to higher and lower expressed alleles of each eQTL in adipose subcutaneous, respectively. Estimated effect size form ASE data tend to be smaller in weak eQTLs and larger for stronger eQTLs as compared to those derived using eQTL data. (E–H) Distribution of absolute log2 aFCs calculated from GTEx adipose subcutaneous as function of minor allele frequency (E), gene expression level (F), number of tissues where the gene is expressed >0.1 RPKM in 10 or more individuals (G), and logistic-transformed RVIS, a measure of each gene's tolerance to variation in the coding region (H) (Petrovski et al. 2013). Red line shows fit by robust locally weighted scatterplot smoothing.


