
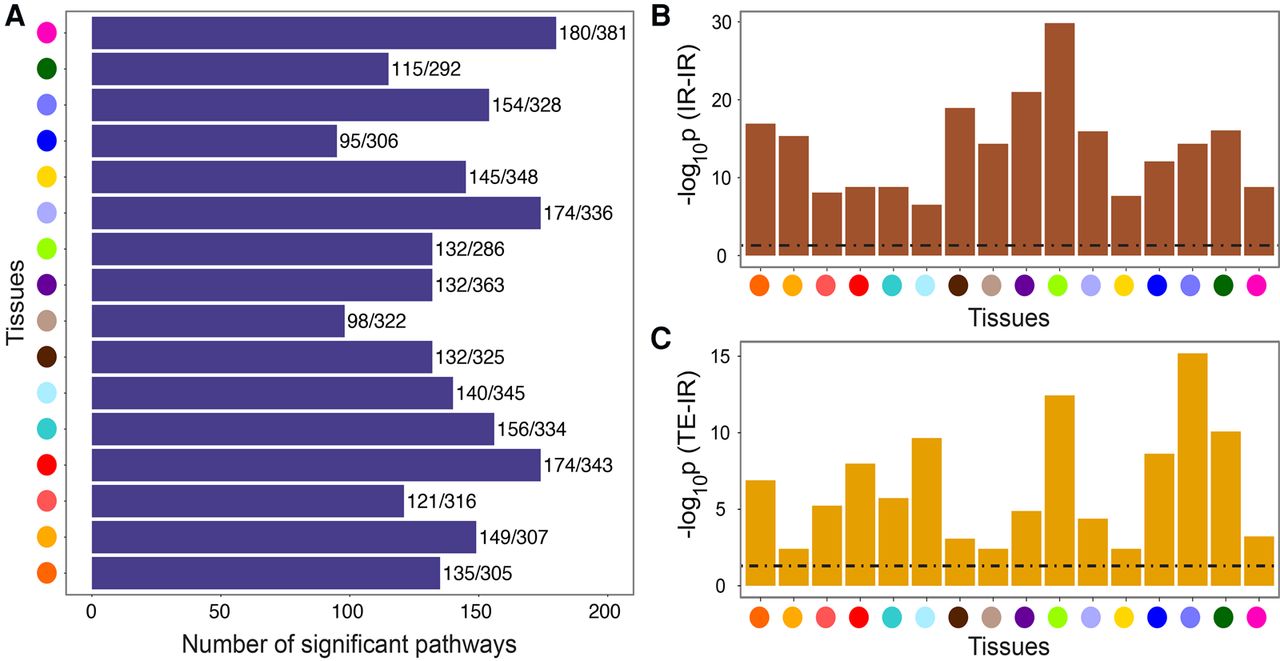
Figure 4.
Pathway enrichment in TWNs. Tissue colors are matched with tissue names in Figure 2. (A) Per-tissue, the number of Reactome pathways enriched among connected components/total number of tested pathways for that tissue, considering only TE nodes. (B) Enrichment for shared Reactome pathway annotation among gene pairs connected by an edge between two TE nodes. (C) Enrichment for shared Reactome pathway annotation among gene pairs connected by an edge between a TE and an IR node.


