
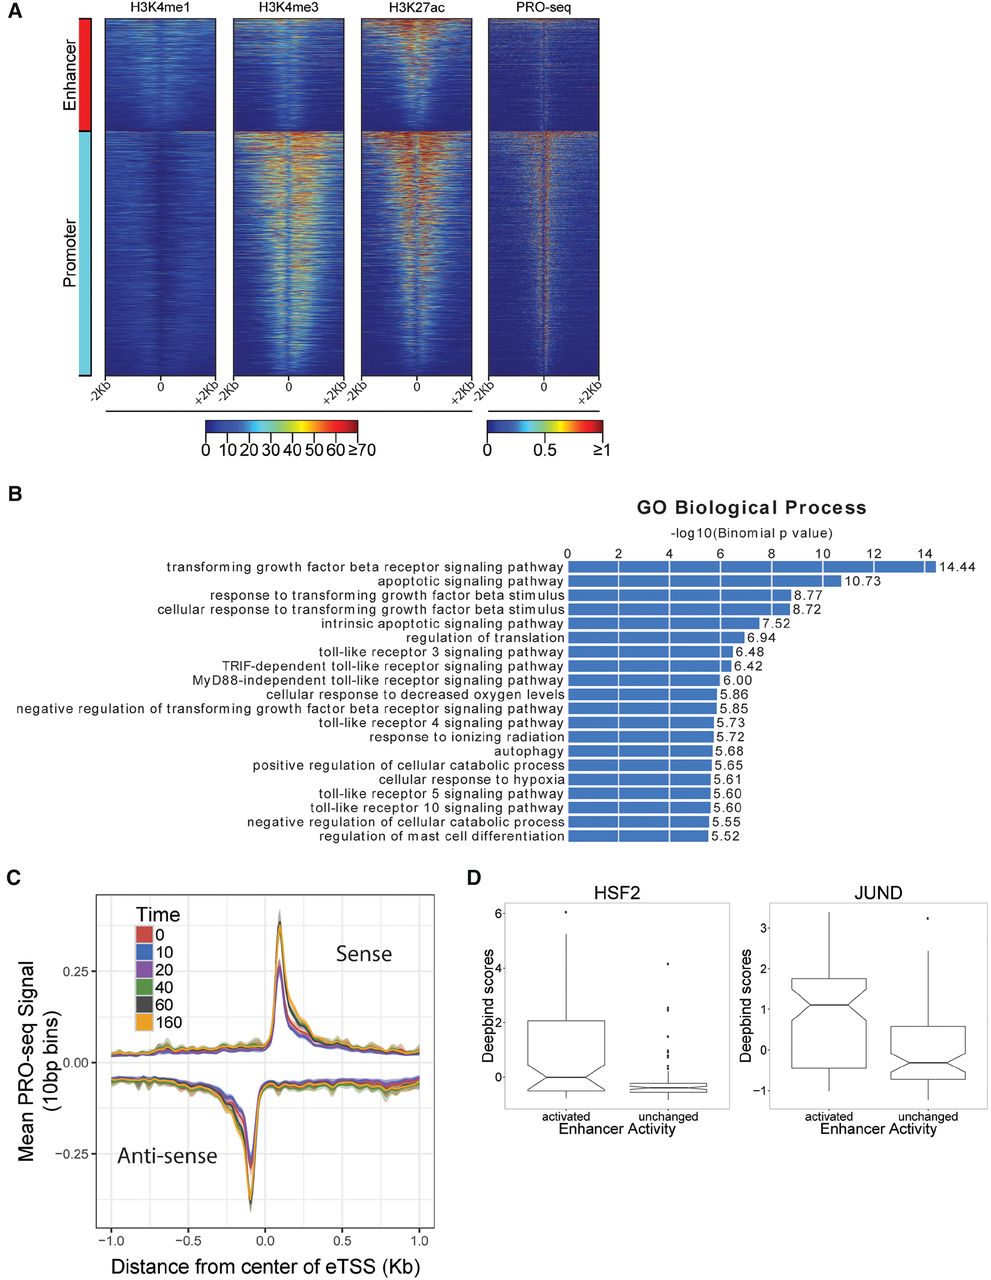
Response to celastrol at predicted transcribed enhancers. (A) Divergent transcription start sites (dTSS) that were classified by distance-based rules as likely enhancers or promoters show distinct patterns of histone marks in untreated K562 cells. Shown are H4K4me1 (enriched at enhancers), H3K4me3 (enriched at promoters), and H3K27ac (enriched at both). PRO-seq read counts are shown for comparison. The x-axis is oriented by direction of transcription of nearest gene. (B) Gene Ontology (GO) biological processes associated with differentially expressed enhancers using GREAT (McLean et al. 2010). Bar plot represents −log10 P-values for enrichment, with numerical fold enrichments indicated at right. (C) Metaplot of PRO-seq signal at all enhancers, centered on the dTSS, per time point. Units of PRO-seq signal are average numbers of reads per 10-bp bin. Intervals around each line represent a 95% confidence interval obtained by bootstrap sampling. (D) The distribution of DeepBind scores for HSF2 and JUND for transcriptionally activated and unchanged sets of enhancers. The notch corresponds to the median ±1.58×IQR/√n, roughly a 95% confidence interval of the median.


