
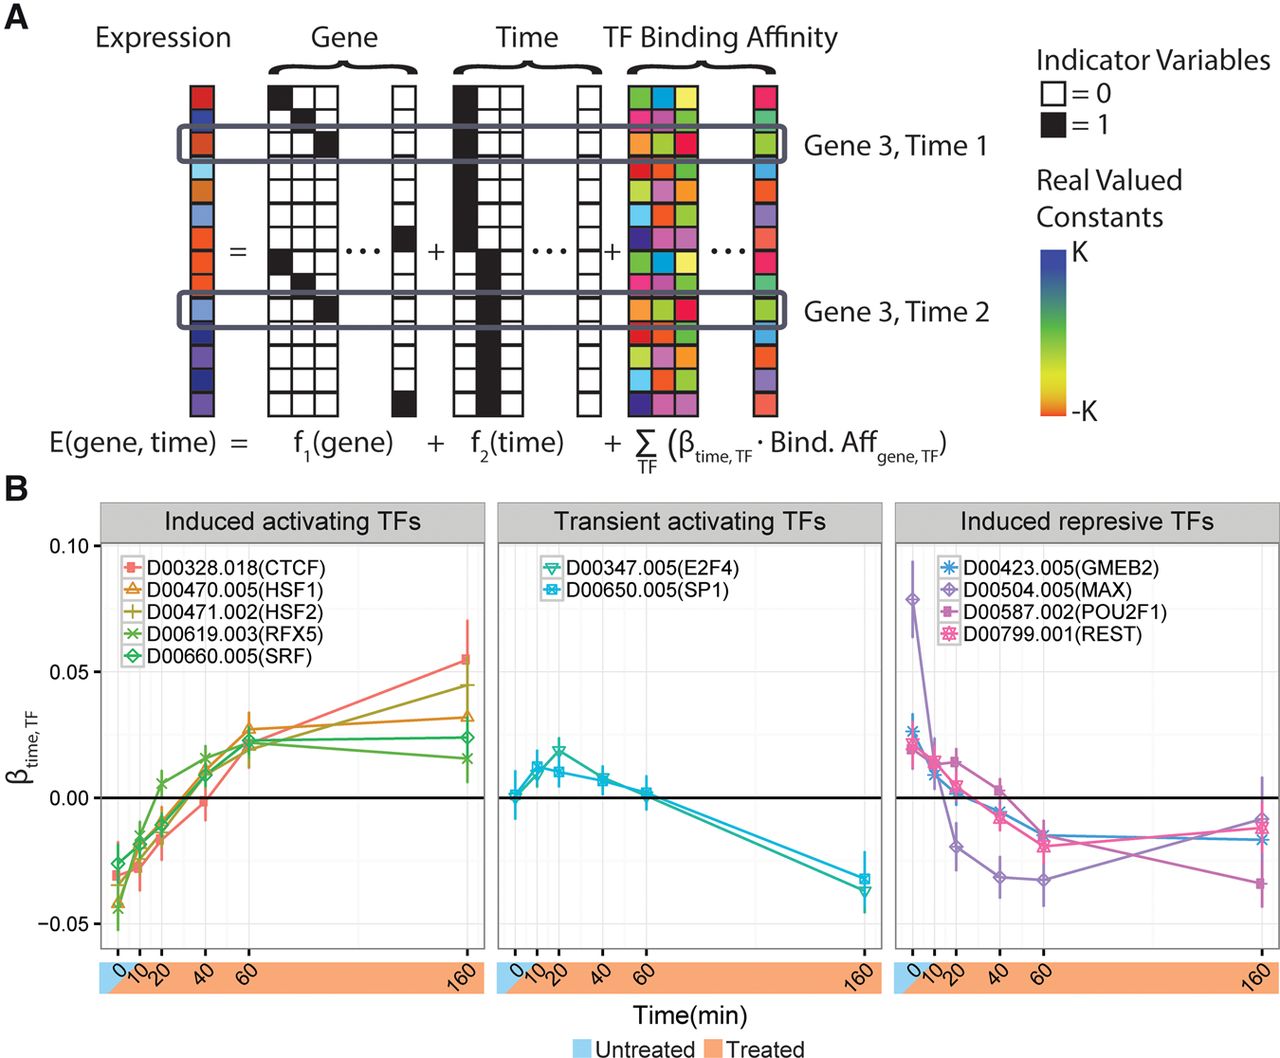
The celastrol response appears to be influenced by various transcription factors. (A) A schematic representation of the regression model used to estimate the impact of TF binding. The predicted expression level for each gene is a linear function of a gene-specific term, a time point-specific term, and a sum of per-time TF-specific effects weighted by the estimated relative TF binding affinity in the promoter regions of differentially expressed genes (from DeepBind or ChIP-seq). Note that the TF binding affinity is estimated from the untreated state and is invariant across time. (B) The estimated TF- and time-specific coefficients from the DeepBind-based regression model. Error bars correspond to the 95% CI estimates for each coefficient. Each gene (e.g., HSF1) is labeled by its DeepBind motif (e.g., D00470.005) in the legend. Only TFs with at least one significant time point (FDR ≤ 0.01) and an absolute effect size in the 90th percentile or above are shown. A positive weight for a TF at a given time point indicates that genes at which that TF is predicted to be bound showed increased expression relative to those without it. Negative weights indicate decreased expression. The three separate plots represent manually selected clusters of TFs associated with distinct temporal patterns. The time point-specific TF coefficients explain ∼11% of the residual variance not explained by gene-specific or time point-specific terms.


