
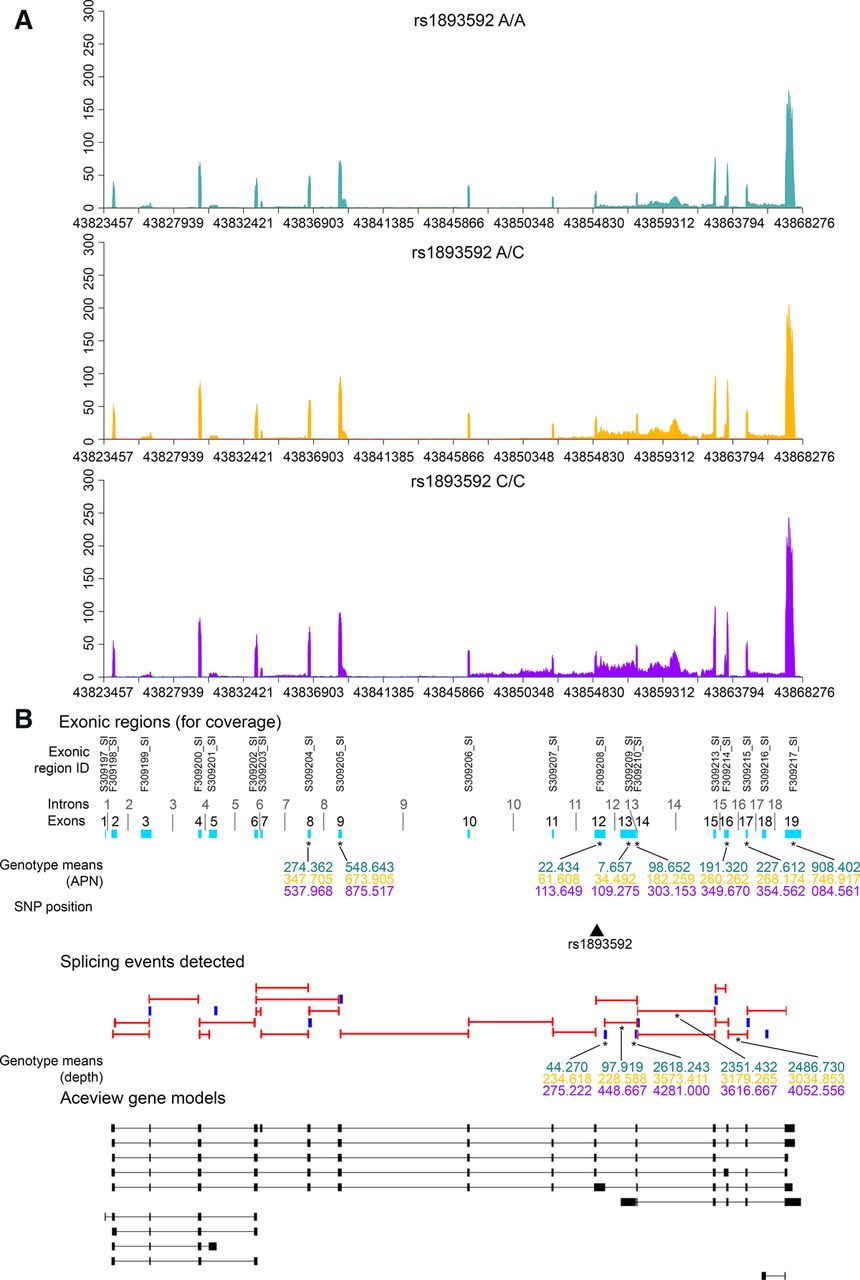
UBASH3A gene expression by rs1893592 genotypes in CD4+ T cells. (A) Distribution of sequencing coverage across UBASH3A for each genotype of rs1893592: A/A (teal), A/C (gold), C/C (purple). (B) Splicing events detected in UBASH3A and UBASH3A gene models from AceView annotations. Detected junctions are indicated by red bars and putative IR events by blue blocks. AceView gene models for UBASH3A are indicated by black blocks and bars, and cyan blocks represent the collapsed gene model for UBASH3A. Splicing events and exons associated with rs1893592 are denoted by an asterisk (*), with mean coverage for the A/A (teal), A/C (gold), and C/C (purple) genotypes. Exons (cyan blocks in collapsed gene models) are numbered sequentially by start and stop positions 5′ to 3′ on the + strand.


