
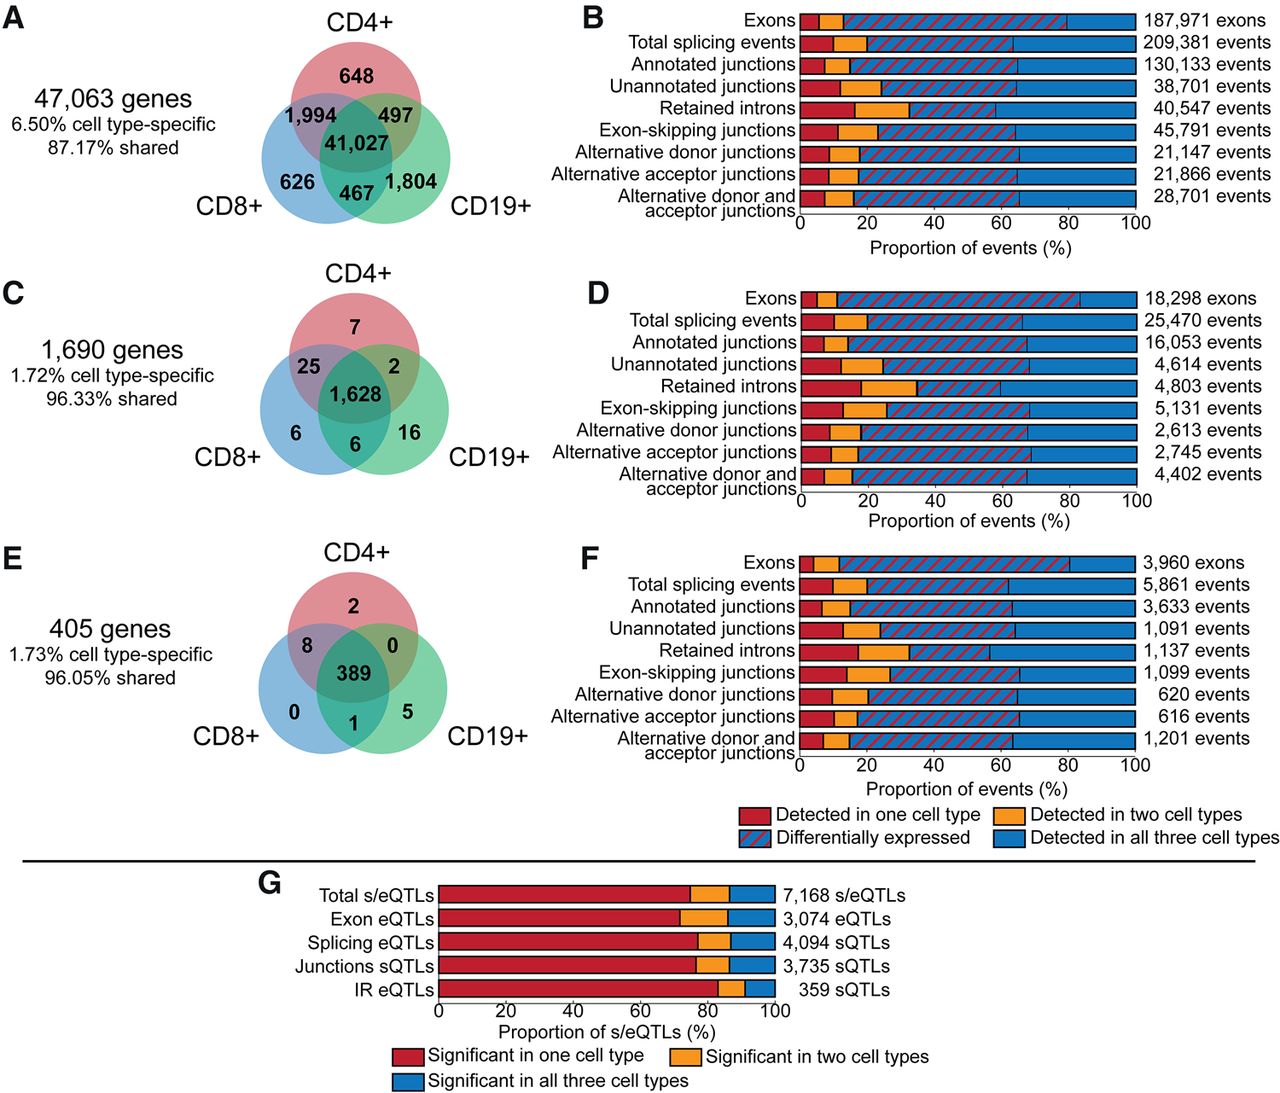
Summary of gene expression and splicing analysis. (A) Genes expressed in CD4+ T cells (red), CD8+ T cells (blue), and CD19+ B cells (green). (B) Proportion of detected exons and splicing events of all genes expressed in at least two cell types in one cell type (red), two cell types (yellow), and all three cell types (blue). The proportion of exons and AS events detected in all three cell types and quantitatively different in at least one cell type is indicated by red hatching. (C) Autoimmune candidate genes expressed in CD4+ T cells, CD8+ T cells, and CD19+ B cells. (D) Proportion of detected exons and splicing events of autoimmune candidate genes expressed in one cell type (red), two cell types (yellow), and all three cell types (blue). (E) T1D candidate genes expressed in CD4+ T cells, CD8+ T cells, and CD19+ B cells. (F) Proportion of detected exons and splicing events of T1D candidate genes expressed in one cell type (red), two cell types (yellow), and all three cell types (blue). (G) cis-eQTL and sQTL in autoimmune disease candidate genes for exons and splicing events detected in all three cell types. The proportion of s/eQTL significant (FDR P < 0.05) in one cell type (red), two cell types (yellow), and all three cell types (blue).


