
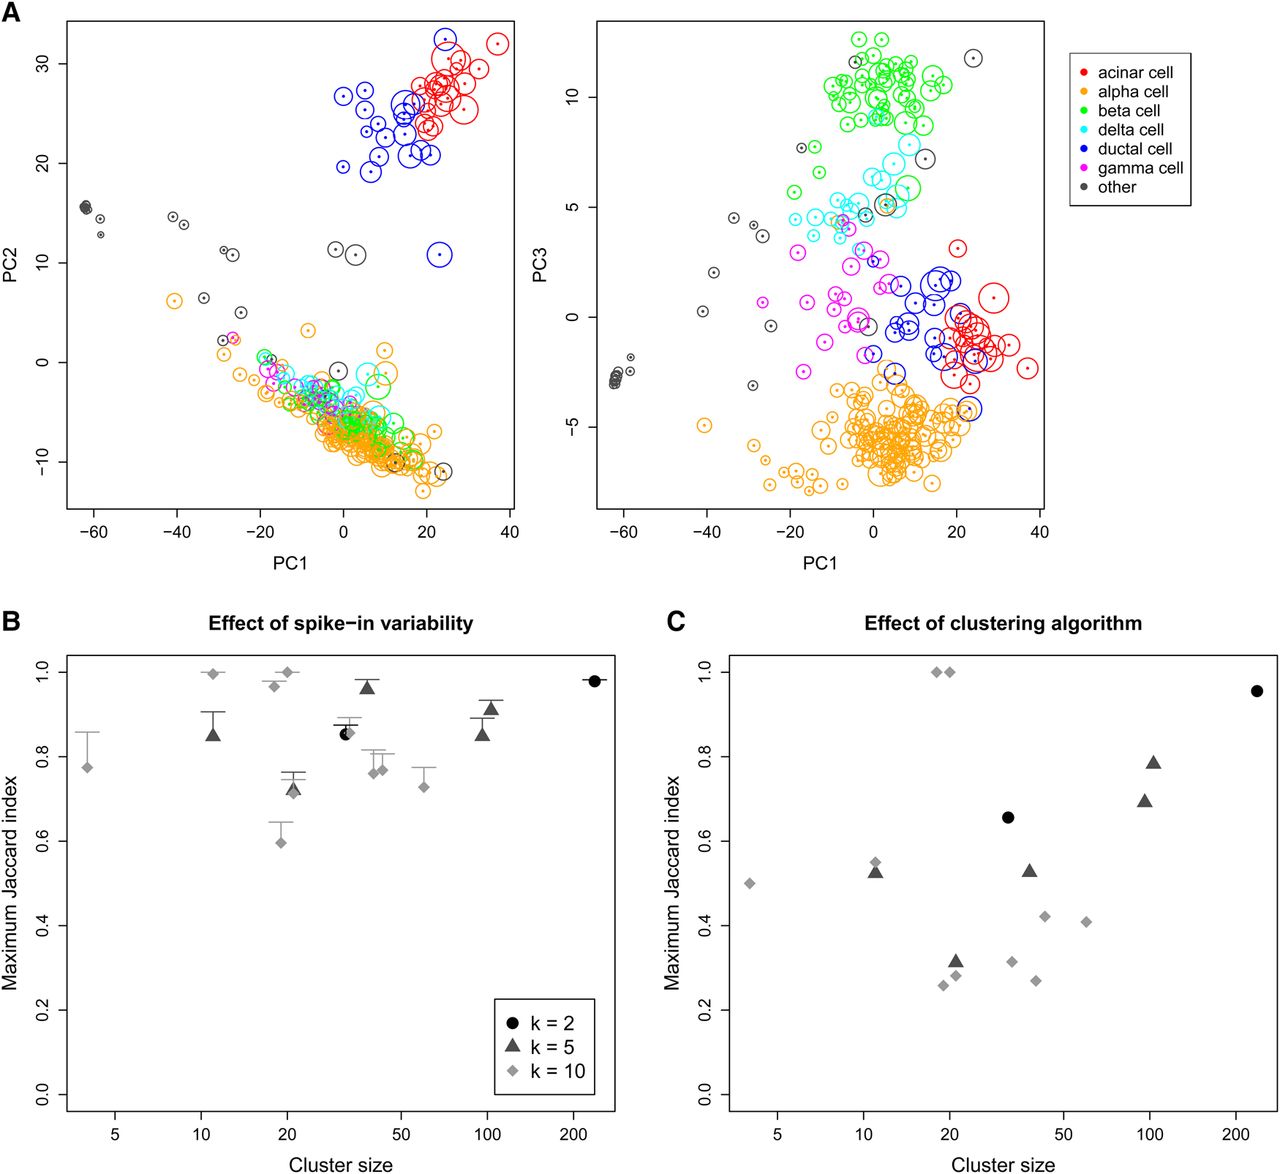
Effect of spike-in variability on dimensionality reduction and clustering in simulated data, based on real scRNA-seq data for cells extracted from a healthy human pancreas (Segerstolpe et al. 2016). (A) PCA plots of the first three principal components, in which each cell is colored according to its annotated cell type from the original study. The circle around each cell contains 95% of remapped locations across the simulation iterations, and represents the deviation in location due to spike-in variability. (B) Clusters were identified from the original data by hierarchical clustering with Ward's criterion, followed by a tree cut with k of 2, 5, or 10. This was repeated at each simulation iteration, and the maximum Jaccard index between each original cluster and any of the simulated clusters at the same k was computed. Each value represents the mean of 20 simulation iterations, and the error bars represent standard errors. (C) The maximum Jaccard index for each original cluster generated with Ward's criterion compared to clusters generated from complete-linkage clustering of the original data.


