
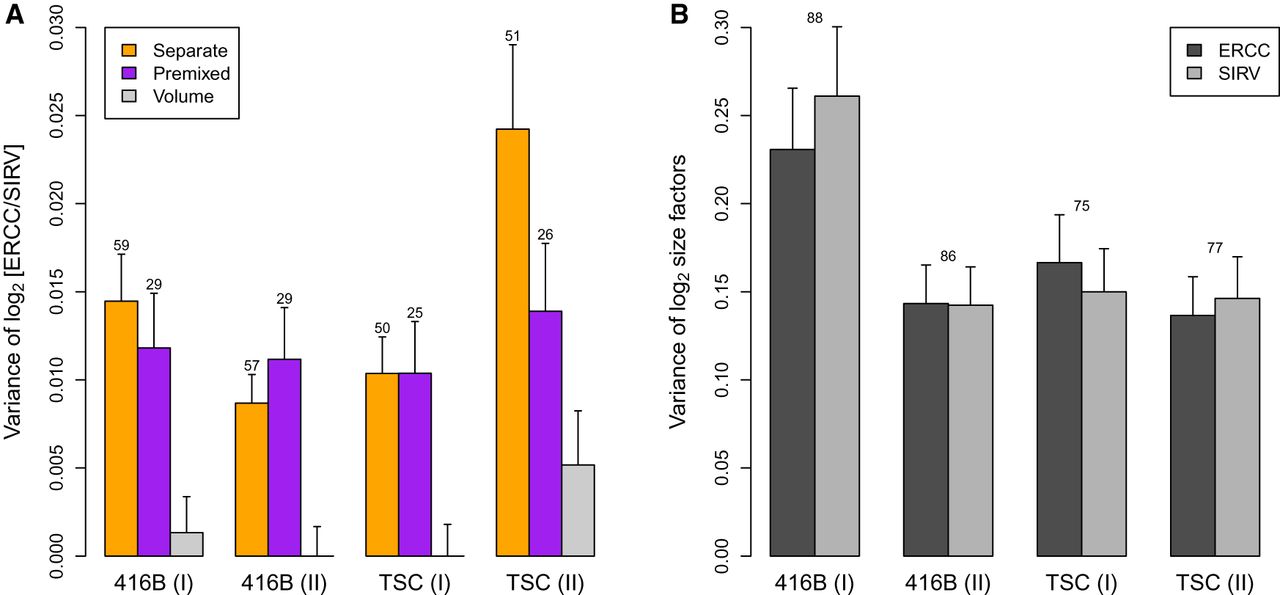
Variance estimates of the log2-ratio between the ERCC and SIRV total counts across wells (A) or the log2-size factors computed from those totals (B). For the separate/premixed experiments, each estimate is the residual variance of a linear model fitted to the log-ratios
across the corresponding wells on each plate. The variance of volume addition is  in our framework. For the log-size factors, each estimate is the residual variance of a linear model fitted to all cells
on each plate. Results are shown for experiments with 416B cells or TSCs, with two replicate plates for each cell type. Error
bars represent the standard errors of the estimates, assuming log-values are normally distributed. Numbers represent the residual
degrees of freedom used for each estimate—for B, this was the same for each spike-in set. Differences between the separate-addition and premixed estimates for each batch
were assessed using a one-sided F-test, yielding P-values of 0.28, 1.00, 1.00, and 0.06 from left to right.
in our framework. For the log-size factors, each estimate is the residual variance of a linear model fitted to all cells
on each plate. Results are shown for experiments with 416B cells or TSCs, with two replicate plates for each cell type. Error
bars represent the standard errors of the estimates, assuming log-values are normally distributed. Numbers represent the residual
degrees of freedom used for each estimate—for B, this was the same for each spike-in set. Differences between the separate-addition and premixed estimates for each batch
were assessed using a one-sided F-test, yielding P-values of 0.28, 1.00, 1.00, and 0.06 from left to right.


