
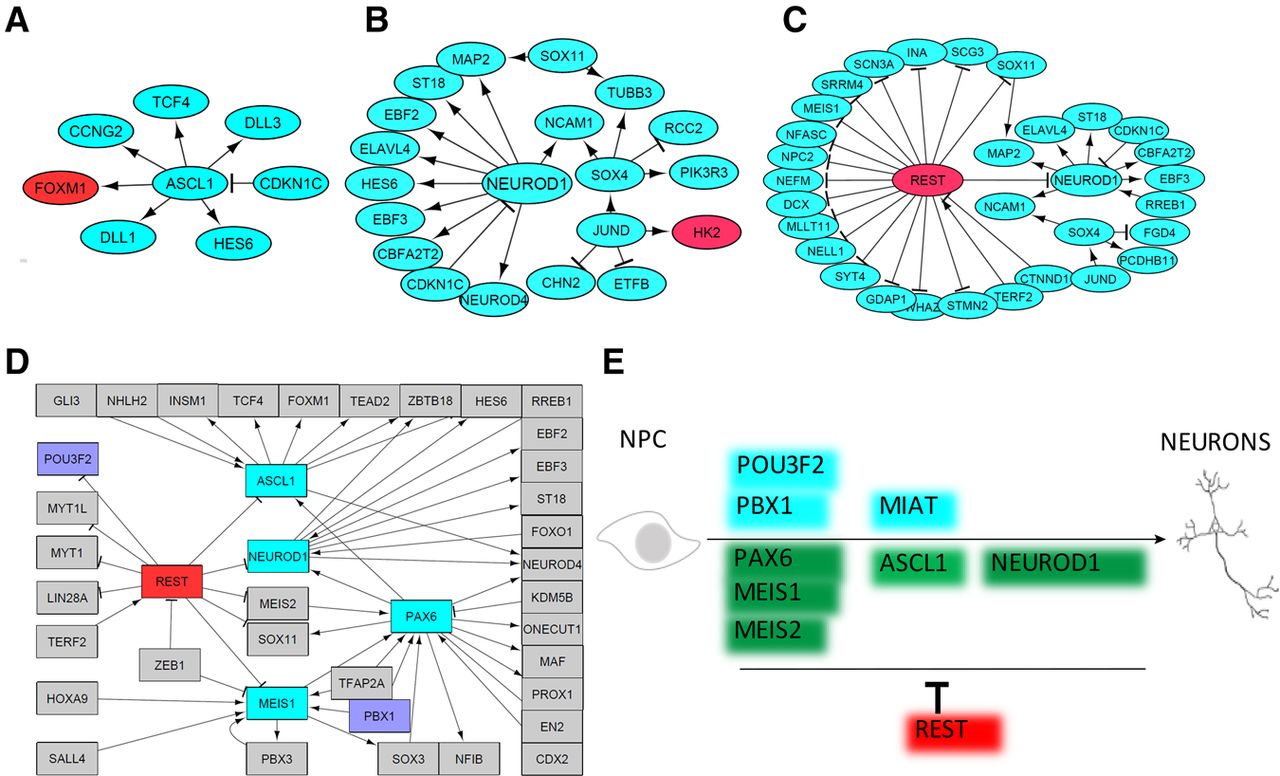
Network analyses of subpopulations reveal underlying mechanism. Gene regulatory networks were assembled based on differential gene expression to define key regulatory pathways that control development of the unique “c” subpopulation. Networks were generated for day 1 (A), day 5 (B), and day 10 (C). The genes labeled in red and green are expressed at low and high levels, respectively, in the “c” cell subpopulation relative to the other cell subpopulation at a given time point. (D) A regulatory network analysis was performed for the 195 TFs that were identified as differentially expressed across all the cell subpopulations and all time points. Purple highlighted genes were chosen for functional validation in Figure 4. (E) A simple model for the dynamic regulators of neuronal development. PAX6, MEIS1, MEIS2, ASCL1, and NEUROD1 are well-known key genes during neurogenesis that were identified by our subpopulation analysis; POU3F2, MIAT, and PBX1 were newly identified by our subpopulation analysis and are critical during neurogenesis. REST, which is identified by our subpopulation analysis, is a well-known repressor during neurogenesis.


