
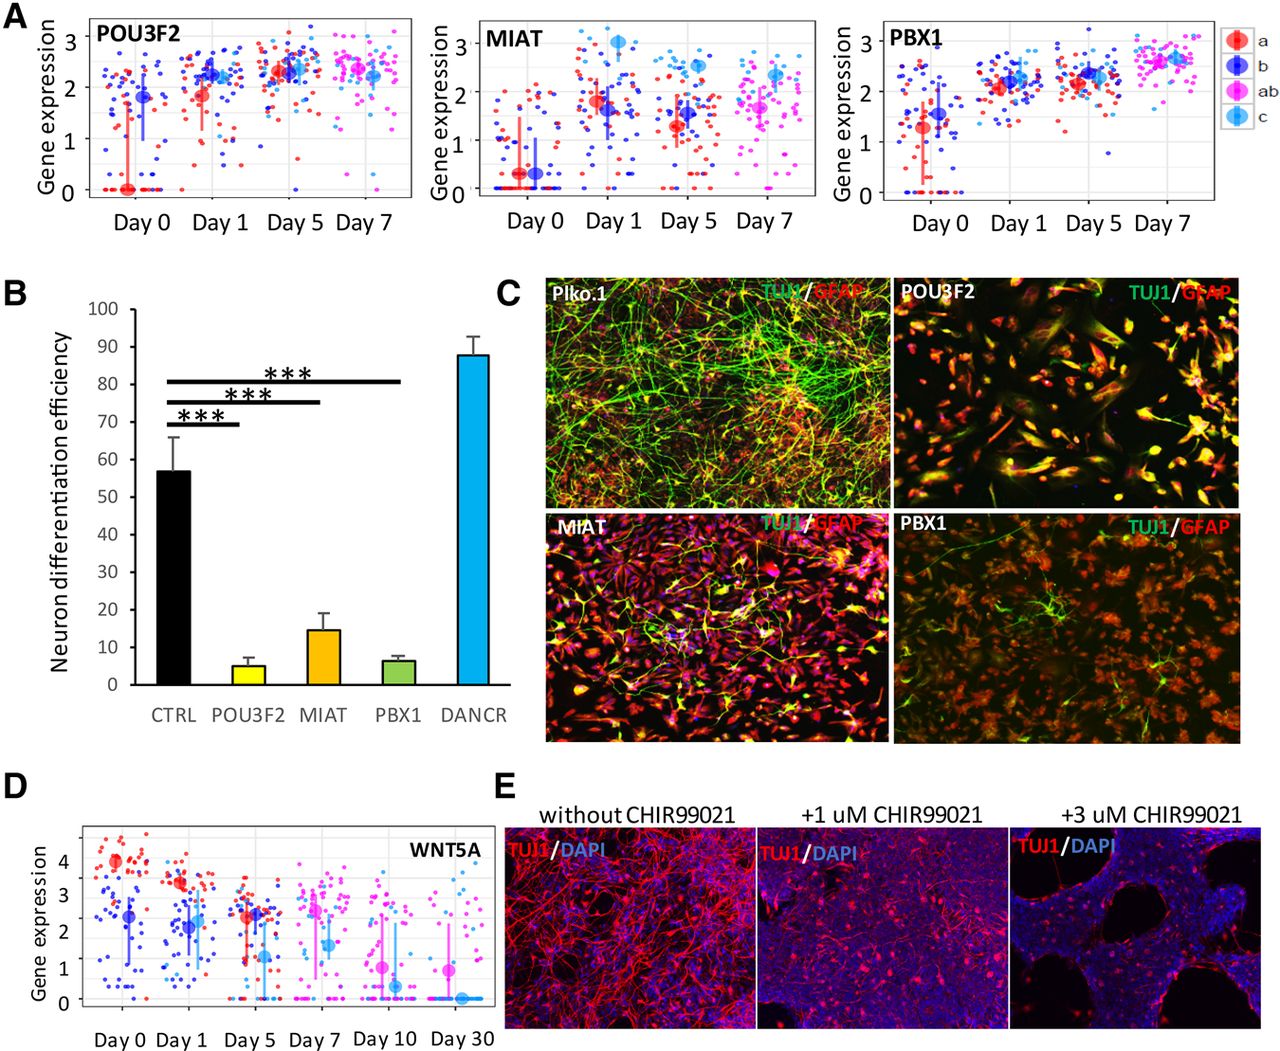
Subpopulation analyses reveal key regulators. (A) Similar to Figure 3B, the expression levels of genes in different cell subpopulations of different time points is shown in dot plots. (B) Knockdown of gene expression experiments was performed for TFs POU3F2, PBX1, and lincRNA MIAT and DANCR during neuronal differentiation (the empty plko.1 vector served as a negative control). (C) Neuron marker TUJ1 (green) and Astrocyte marker GFAP (red) after 7 d of knock down of these candidates. Immunostained images were quantified by Columbus Analysis System to determine the neuron differentiation efficiency. (D) The expression level of WNT5A in different cell subpopulations of different time points is shown in dot plots. (E) NPCs were cultured in neuron differentiation media with different concentrations of WNT signaling activator CHIR99021. Seven days later, immunostaining was performed for neuron marker TUJ1 (red), and nuclei were stained with DAPI (blue). The concentration of CHIR99021 is as shown.


