
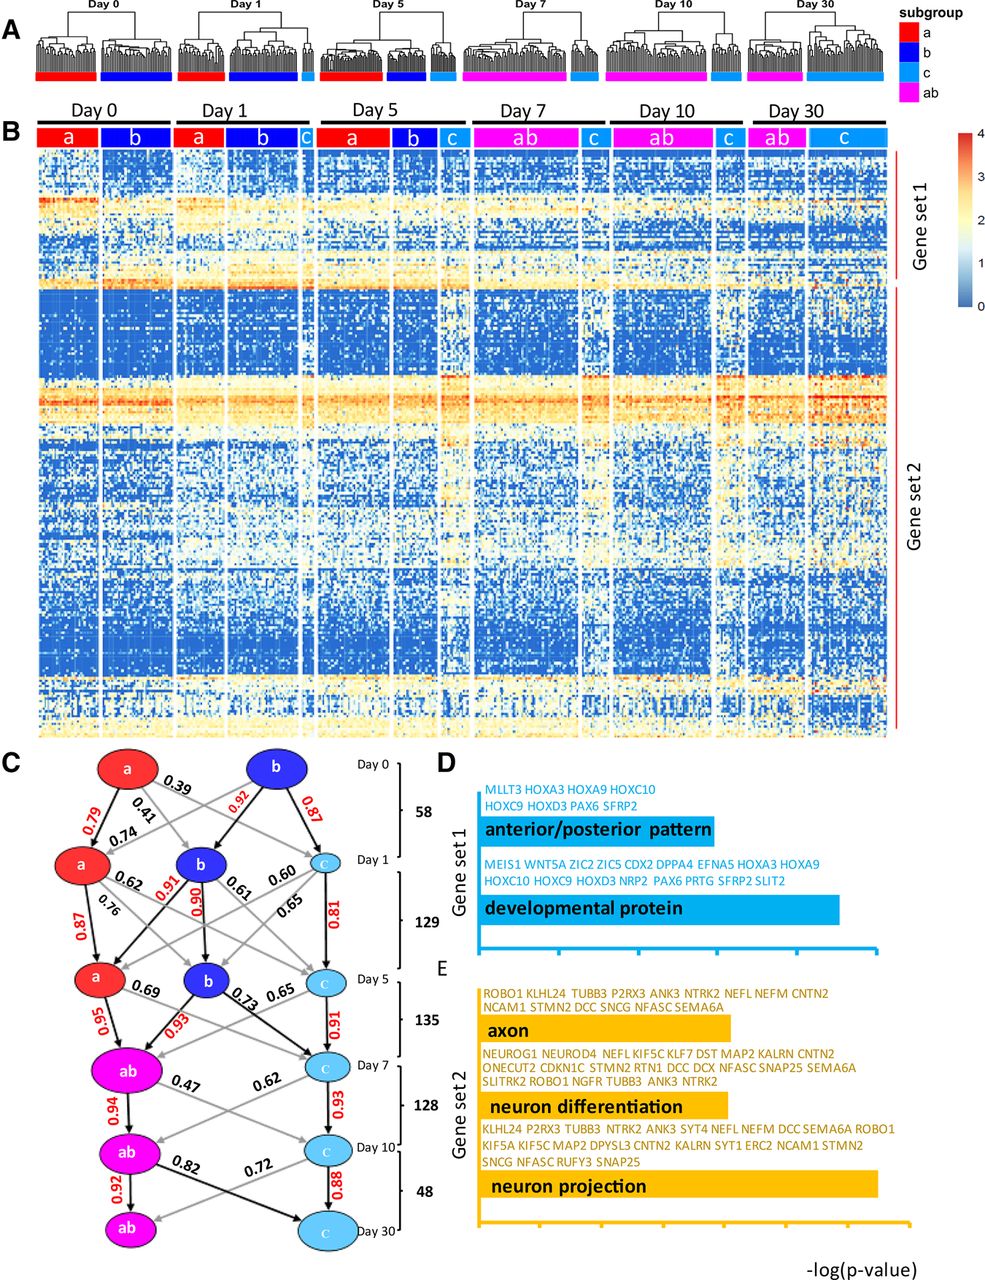
Defining and tracking of subpopulations throughout the time course of differentiation. (A) Hierarchical cluster analysis for each time point was performed by bootstrapping based on the derived 528 DC genes as Figure 1F. (B) A heat map showing common DE genes between cell subpopulations in any two neighboring time points after defining the clusters at each time point. (C) The Pearson correlation coefficients between any two cell subpopulation for two neighboring time points were calculated based on the common DE genes between subpopulations of any two neighboring time points. The common DE genes between neighbor time points are as shown. The correlation values are shown with highest values as indicated (red numbers, black line). Gene ontologies associated with gene set 1 (D) and gene set 2 (E) were generated by David analysis (Bioinformatics 6.7). The top GO terms are shown with representative genes highlighted with blue (gene set 1) and brown (gene set 2). The x-axis indicates the −log (Benjamini P-value).


