
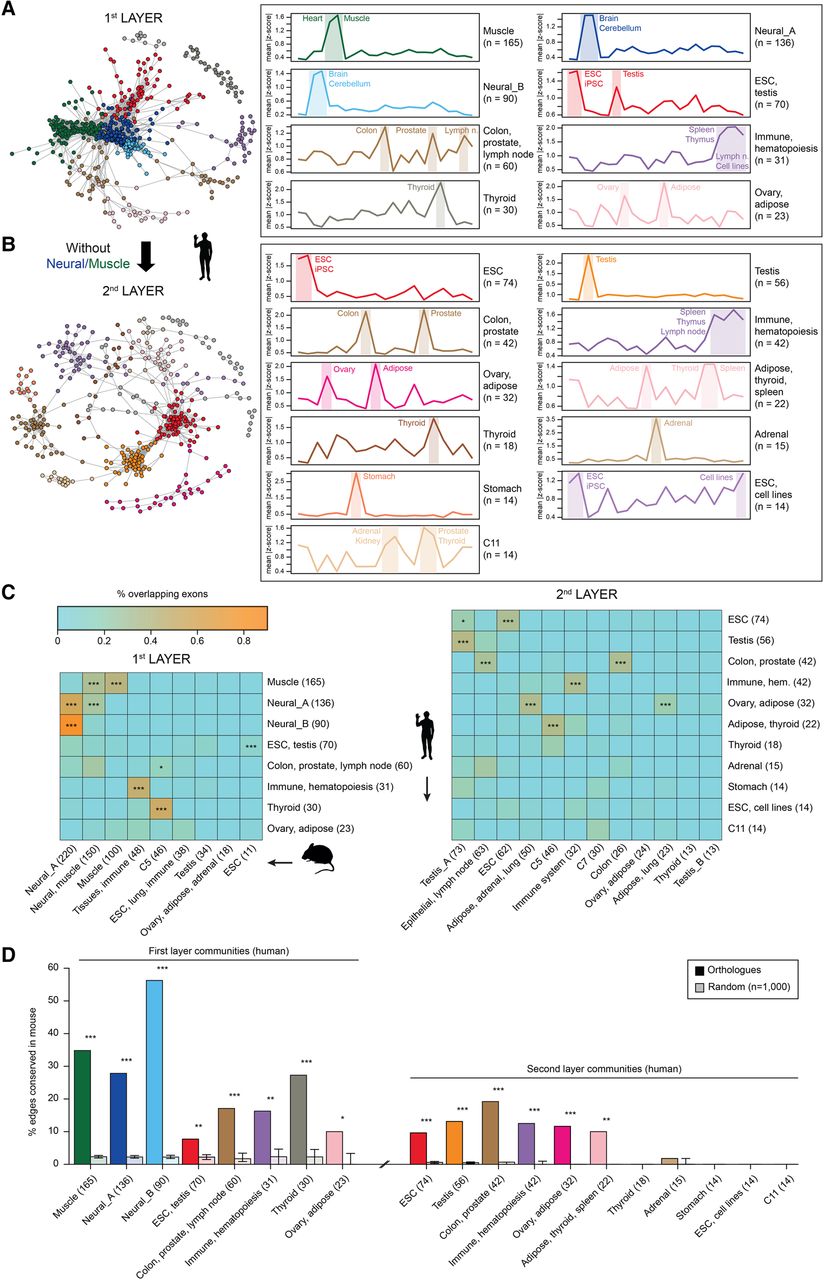
Coregulated splicing network reveals two layers of tissue AS regulation. (A,B) Left: Graphical representation of the human splicing networks, highlighting the different exon communities for the first (A) and second (B) layer networks. Right: Plot of the mean absolute Z-score across tissues for each community of the first (A) and second (B) layer human networks. Dominant tissues are highlighted. Communities were named based on dominant tissues, when possible. For simplicity, only communities with 10 or more AS events are displayed. (C) Heatmap showing the percentage of node (exon) overlap between human (y-axes) and mouse (x-axes) communities for the first (left) and second (right) layer networks. P-values correspond to Bonferroni-corrected one-sided Fisher's exact tests. (D) Percentage of edge conservation for each main human community in the mouse network, for the first (left) and second (right) layer networks, and expected percentage of conservation based on randomized networks of the same size of the tested community. Error bars in controls represent first and third quartiles of the distribution. P-values correspond to permutation tests with 1000 random networks: (***) P-value ≤ 10−3; (**) 10−3 < P-value < 0.01; (*) 0.01 ≤ P-value < 0.05.


