
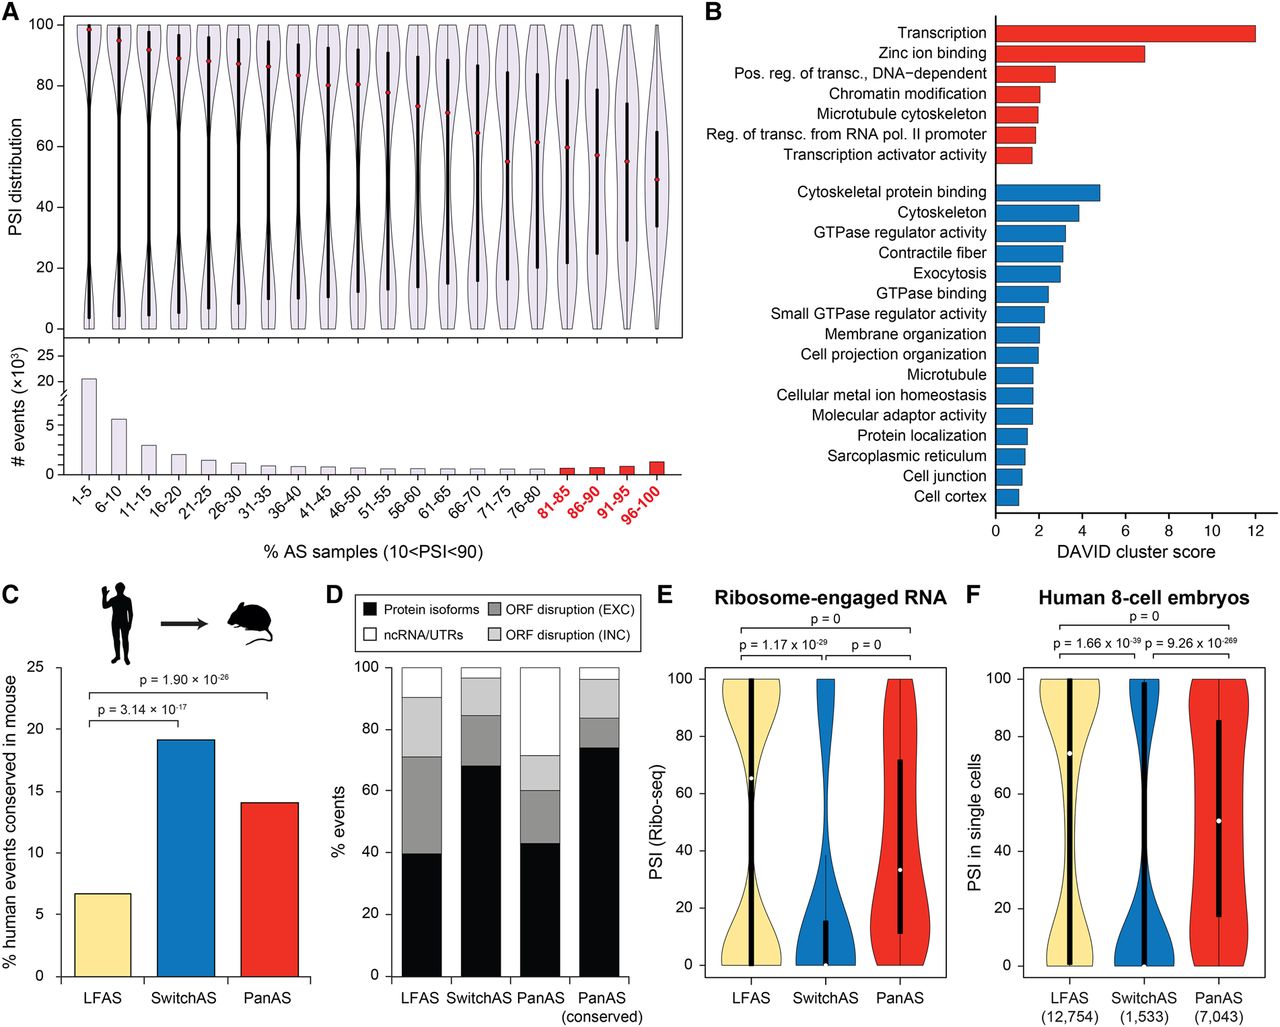
A subset of exons in genes encoding DNA binding proteins is alternatively spliced across most cell and tissue types. (A) Distribution of PSIs across all samples with sufficient read coverage (violin plots, top) and total number of exons (histograms, bottom) for bins of alternative exons that are alternatively spliced (10 < PSI < 90) in an increasing fraction of samples. PanAS exons correspond to those exons that are alternatively spliced in >80% of the samples (i.e., red histograms). (Red dots) median PSI of the bin. (B) Enriched Gene Ontology categories using DAVID scores for genes harboring exons that are alternatively spliced in >80% of the samples (PanAS events; red, four last bins on A) or show switchlike inclusion patterns (SwitchAS; blue). (C) Percentage of human low-frequency AS (LFAS; yellow), SwitchAS (blue), or PanAS (red) AltEx events that have the same class of regulation in mouse orthologous exons. (D) Percentage of human low-frequency AS, SwitchAS, PanAS, and conserved PanAS exons that are predicted to generate alternative ORF-preserving isoforms (black), disrupt the ORF when included/excluded (light/dark gray), or overlap noncoding sequences (white). (E) For each AS group, PSI distributions obtained from ribosome-engaged RNA-seq data from multiple cell types. (F) For each AS group, PSI distributions in individual human eight-cell stage embryo blastomeres. The number of tested exons for each category is provided in parentheses. All P-values correspond to two-sided Fisher's exact tests; for E and F, the numbers of events with PSIs corresponding to alternative (10 < PSI < 90) versus nonalternative events is compared for each AS group.


