
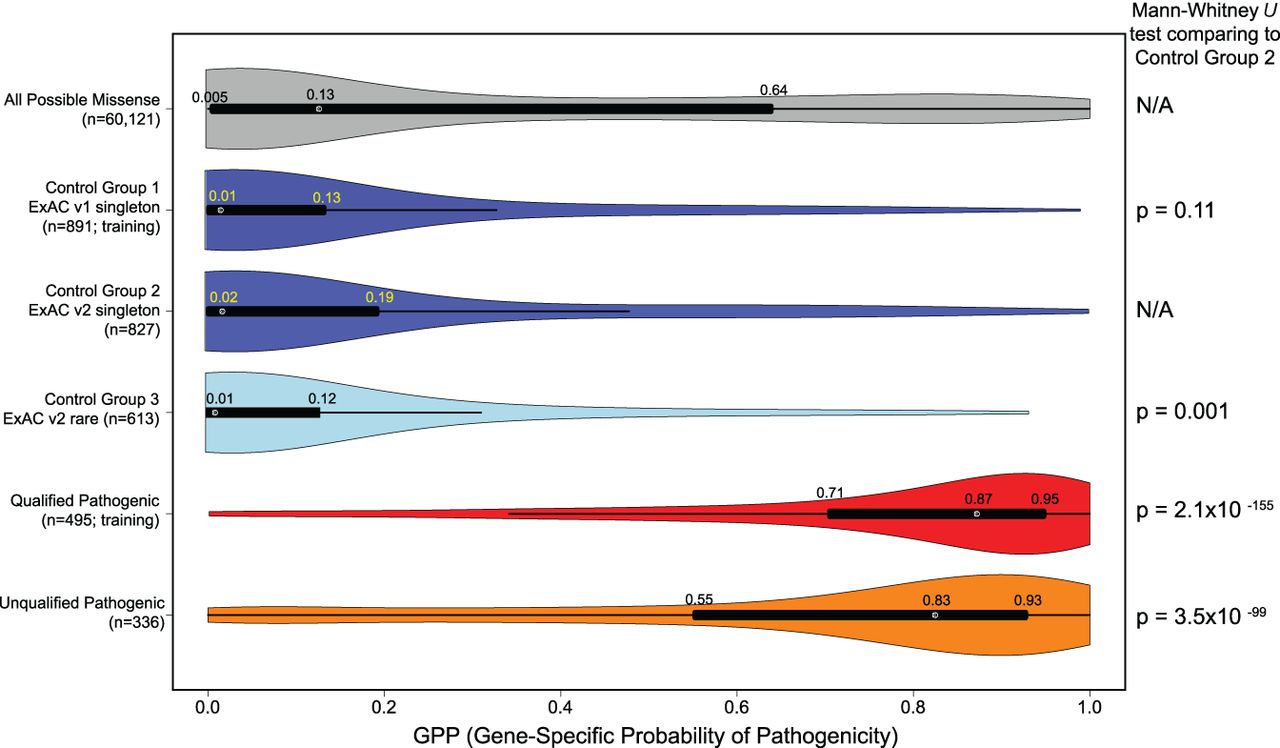
The distribution of the GPP scores from the collection of the six gene-specific logistic models. The tallies of missense variants reported per group reflect the number of missense variants in that group that belong to the six genes for which a multivariate customized logistic model was described in Supplemental Table S5. Control Group 1 and Qualified Pathogenic were the only two groups used to fit the gene-specific models. Control Groups 2 and 3 (presumed enriched for benign) as well as the Unqualified Pathogenic group (presumed enriched for pathogenic variants above that found in population controls) represent missense variants not involved in feature evaluation or model fitting. The Mann-Whitney U tests compare the GPP score distributions from each group to the ExAC v2 Control Group 2 GPP score distribution.


