
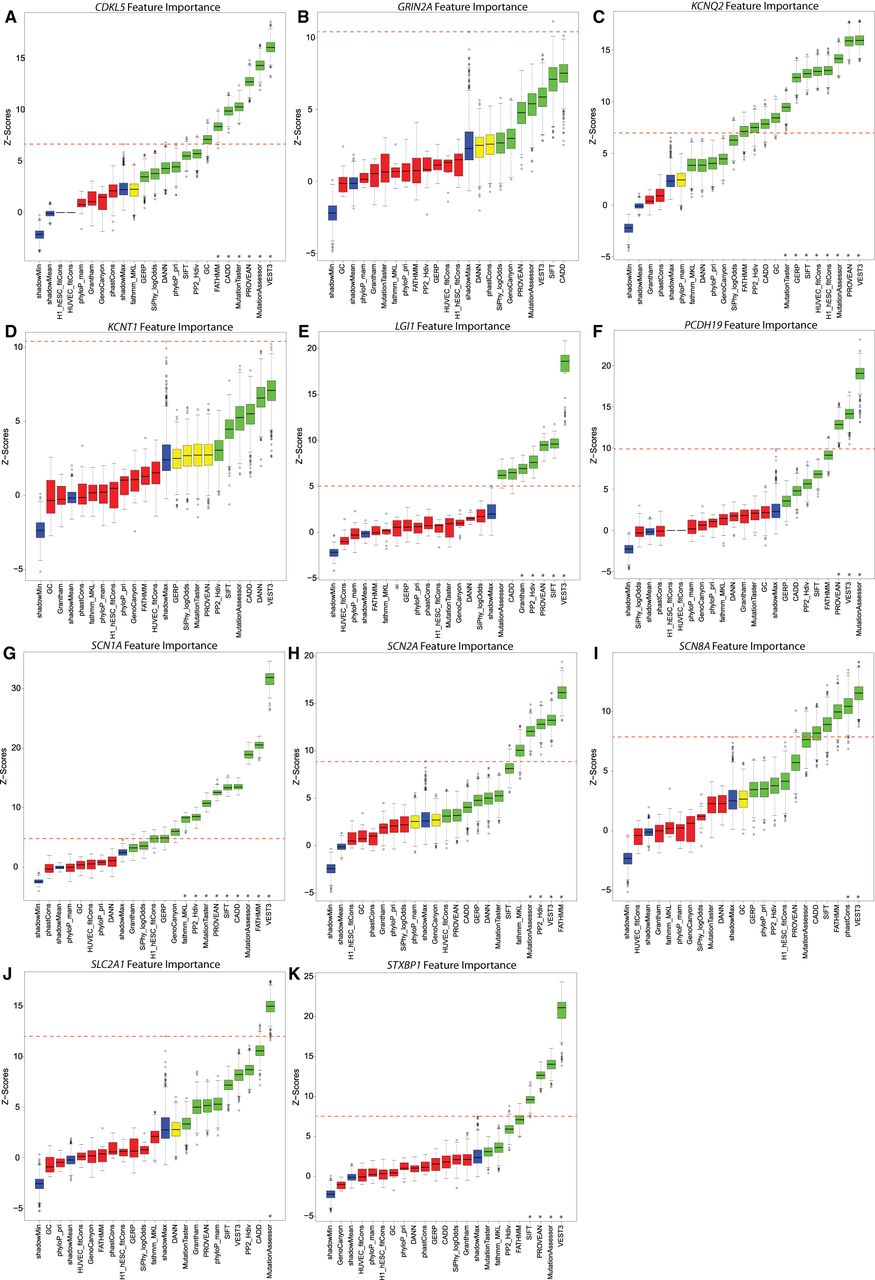
Figure 4.
Boruta feature evaluations: (A) CDKL5; (B) GRIN2A; (C) KCNQ2; (D) KCNT1; (E) LGI1; (F) PCHD19; (G) SCN1A; (H) SCN2A; (I) SCN8A; (J) SLC2A1; and (K) STXBP1. Blue box plots correspond to minimal, average, and maximum Z-score of a shadow feature. Red, yellow, and green box plots represent Z-scores of uninformative, inconclusive, and informative features, respectively. (*) Indicates the “highly informative” features for which the minimum nonoutlier random forest Z-score exceeded the maximum random forest Z-score of the best performing randomized shadow feature (red dashed line).


