
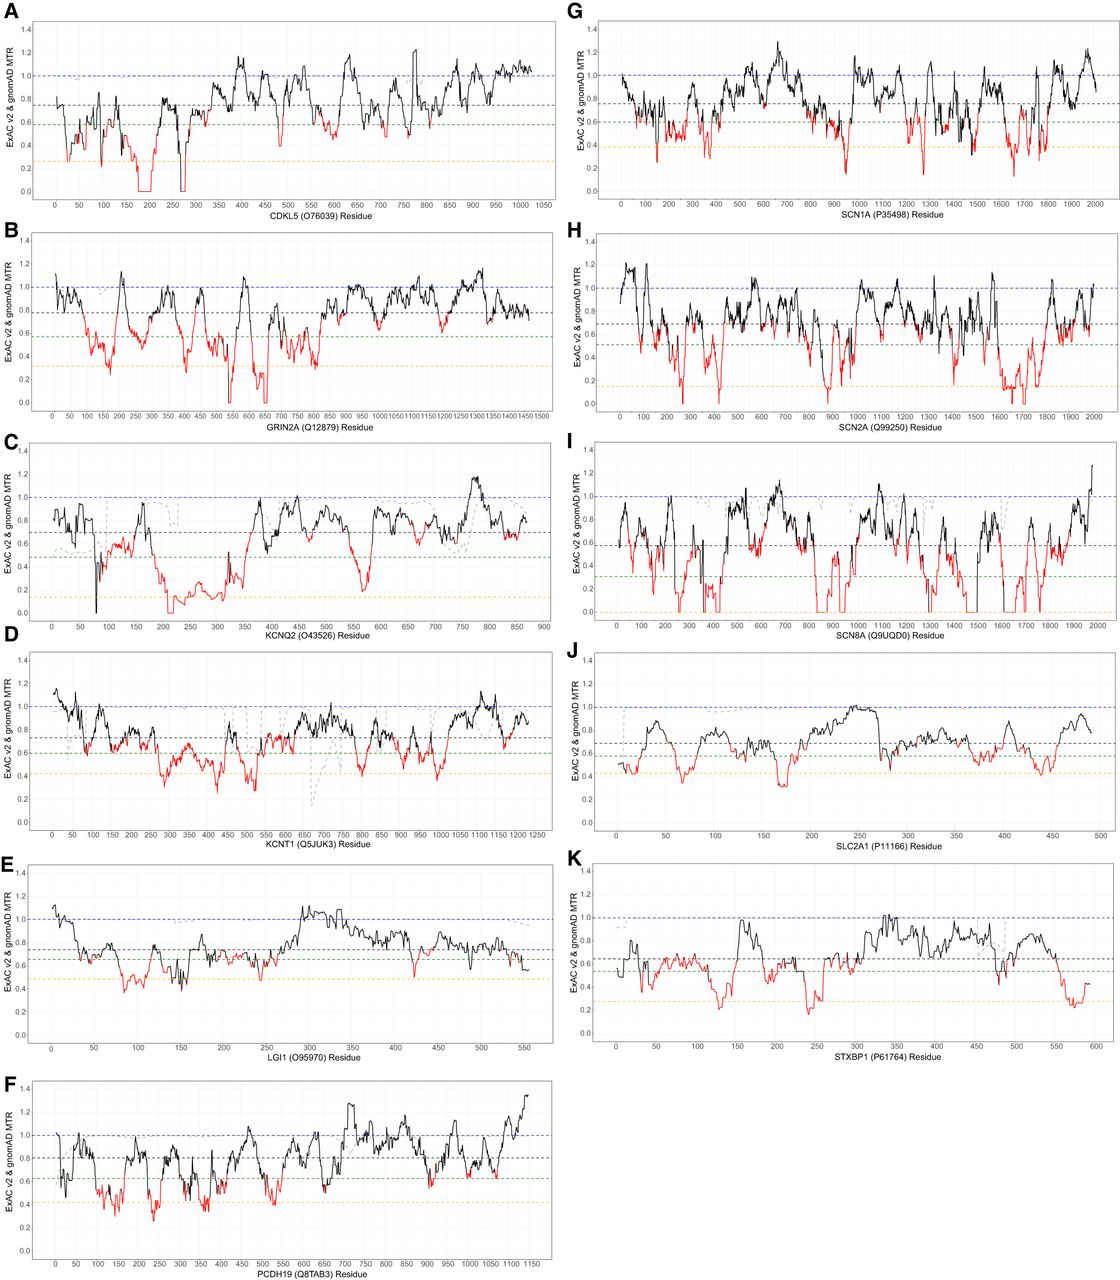
ExAC v2 MTR plots for the 11 epilepsy genes: (A) CDKL5; (B) GRIN2A; (C) KCNQ2; (D) KCNT1; (E) LGI1; (F) PCHD19; (G) SCN1A; (H) SCN2A; (I) SCN8A; (J) SLC2A1; and (K) STXBP1. Regions in red achieved a study-wide FDR < 0.05 (Supplemental Data S3). MTR = 1 is depicted by the dashed blue line. Multiple gene-specific estimates are also depicted, including a gene's median MTR (black dashed line), 25th percentile MTR (dark green dashed line), and 5th percentile lowest MTR estimates (orange dashed line). The gray dashed line reflects how well that region of the gene was covered in the ExAC v2 sample data by showing the proportion of all ExAC v2 samples that achieved at least 10-fold coverage at the sites relevant to that codon (Methods).


