
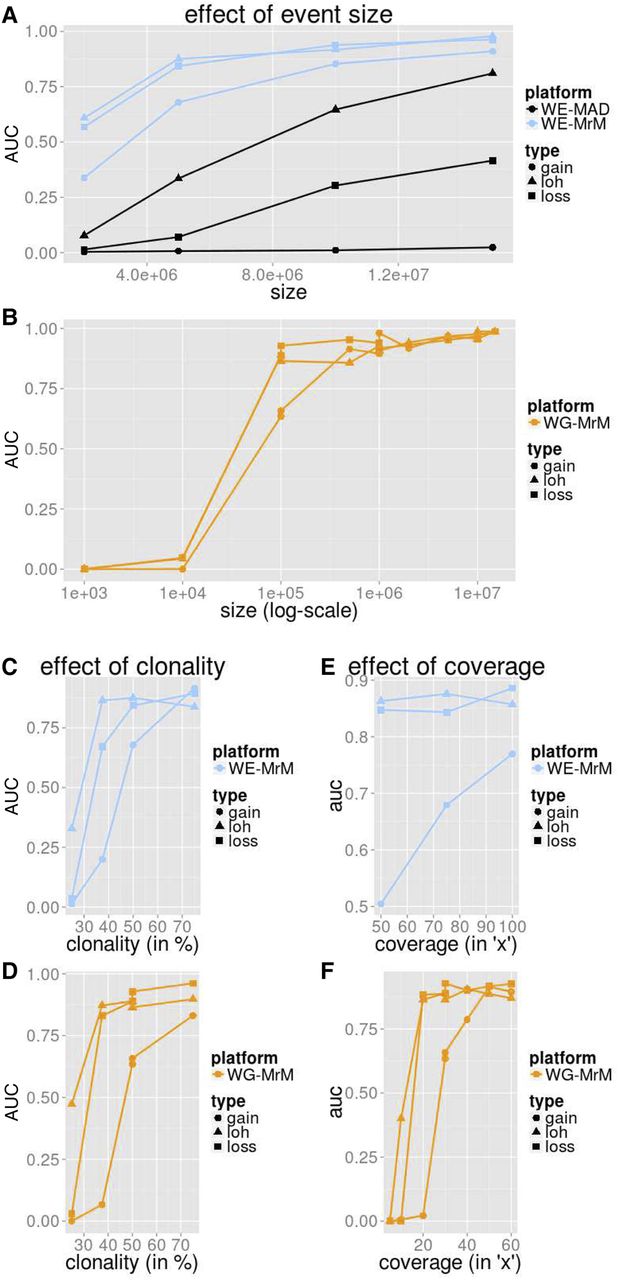
Simulation performance summarized by AUC. We measured the average precision (area under the precision-recall curve [AUC]) for MrMosaic implemented on whole-exome (WE) simulations (A,C,E) and MrMosaic and MAD implemented on whole-genome (WG) simulations (B,D,F). The depth, size, and coverage measured for WES and WGS simulations were selected to accentuate informative differences in performance. AUC across size: Simulated events of 50% clonality were studied for WES (A) and WGS (B) simulations. Although for WES simulations, simulated exome depth was 75× depth, for WGS simulations, it was 30× depth. MrMosaic on whole-genome data (WG-MrM) outperforms MrMosaic on exome data (WE-MrM), which outperforms MAD on exome data (WE-MAD). AUC across clonality: Although for WES (C) simulations, the simulated size and coverage was 5 Mb and 75×, for WGS (D) simulations, it was 100 kb and 30×. AUC across average coverage: Simulated events of 50% were studied for both WES (E) and WGS (F) simulations. Although for WES simulations, simulated event size was 5 Mb, for WGS simulations, it was 100 kb.


