
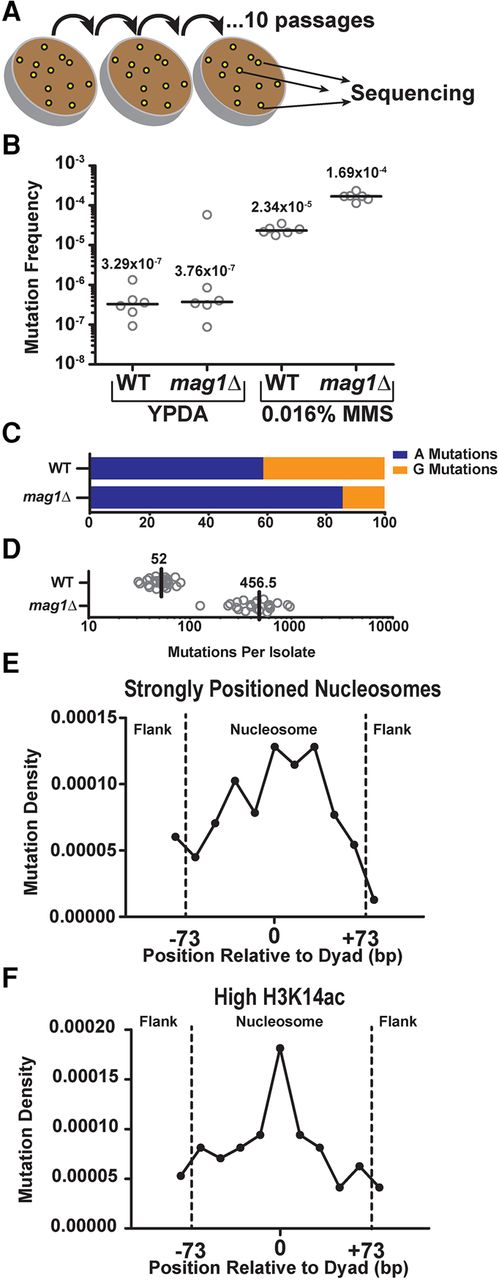
Analysis of MMS-induced mutations across the genome of WT and mag1Δ yeast. (A) Individual isolates (n = 24) of WT and mag1Δ yeast strains were grown on 0.016% MMS-supplemented yeast extract peptone dextrose adenine (YPDA) media at 30°C for 48 h. Separate lines were then streaked for singles (not explicitly shown) on additional MMS plates, for a total of 10 passages. At the end of the passaging, unique isolates were picked for whole-genome sequencing. (B) CanR frequencies were measured for six independent isolates of WT and mag1Δ strains of yeast (open circles), which were either untreated (grown on YPDA media) or treated for 2 d with 0.016% MMS. Black horizontal bars and numbers indicate the median frequency of CanR for each genotype and treatment. Data were analyzed using a two-tailed Mann-Whitney U test. (C) Percentage of A- and G-mutations in whole-genome sequencing of MMS-treated mag1Δ and WT strains. (D) Number of mutations per isolate from whole-genome sequencing of MMS-treated WT and mag1Δ strains. (E) Strongly positioned nucleosomes have elevated mutation density relative to flanking DNA regions in WT yeast. Mutations from MMS-treated WT isolates were mapped to strongly positioned nucleosomes (score > 5) and normalized by sequence context. An area of ∼180 bp was examined, which consisted of the main nucleosome (147 bp) and an additional flank on either side (∼30 bp total). Each DNA sequence was then divided into 11 bins, each of ∼16 bp. Comparisons of the number of mutations observed between nucleosome-bound and flanking DNA was performed using χ2 analysis. (F) Same as in part E, except mutation density in WT yeast was analyzed for 10,000 nucleosomes with the highest levels of H3K14 acetylation (H3K14ac) (Weiner et al. 2015).


