
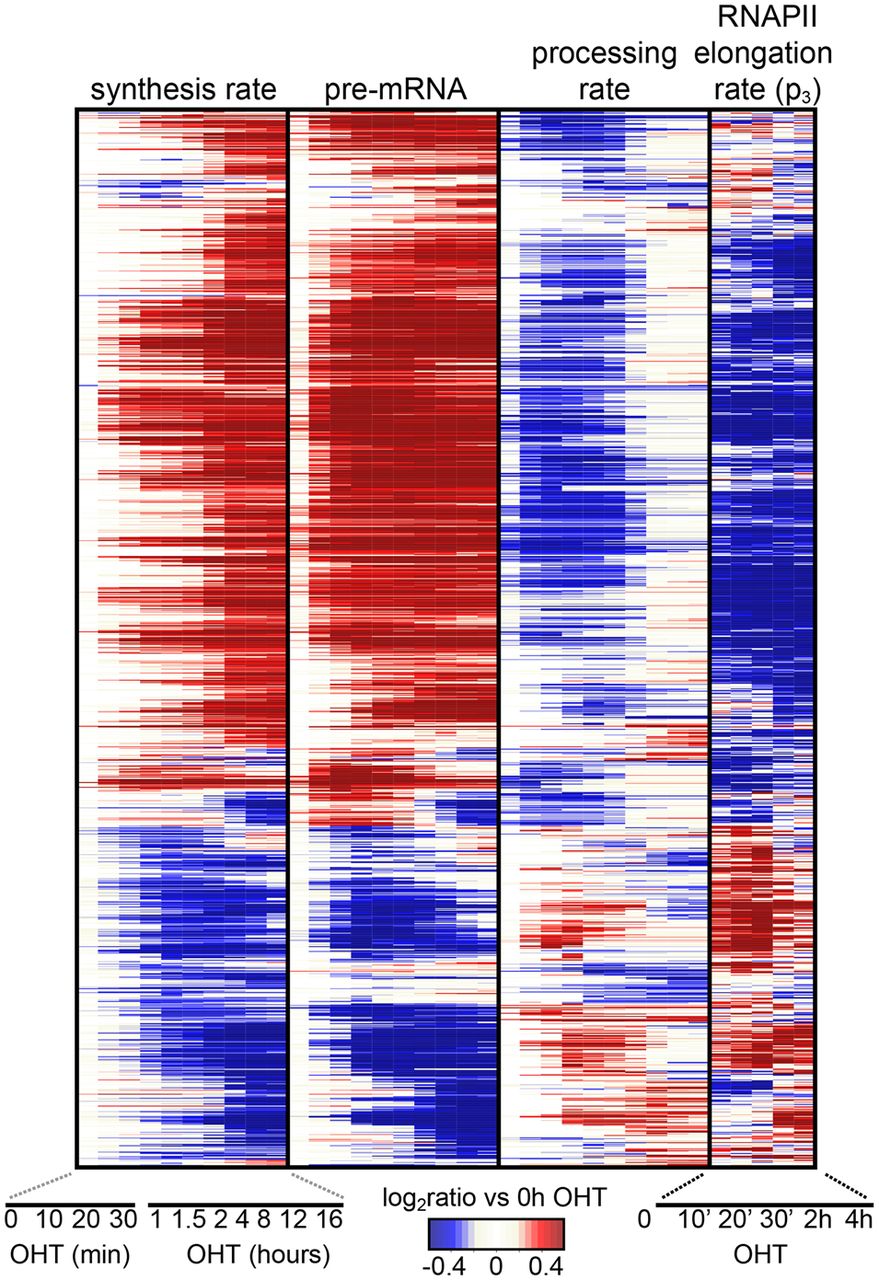
Figure 4.
Dynamics of RNAPII elongation and pre-mRNA processing. Hierarchical clustering of synthesis rates, pre-mRNA concentrations, processing rates, and RNAPII elongation rates for the subset of MYC-bound differentially expressed genes having variable processing rate (1333 genes). Genes and time points are depicted in the rows and columns, respectively, and up- (red) or down- (blue) modulation is determined as the log2 ratio to the untreated condition.


