
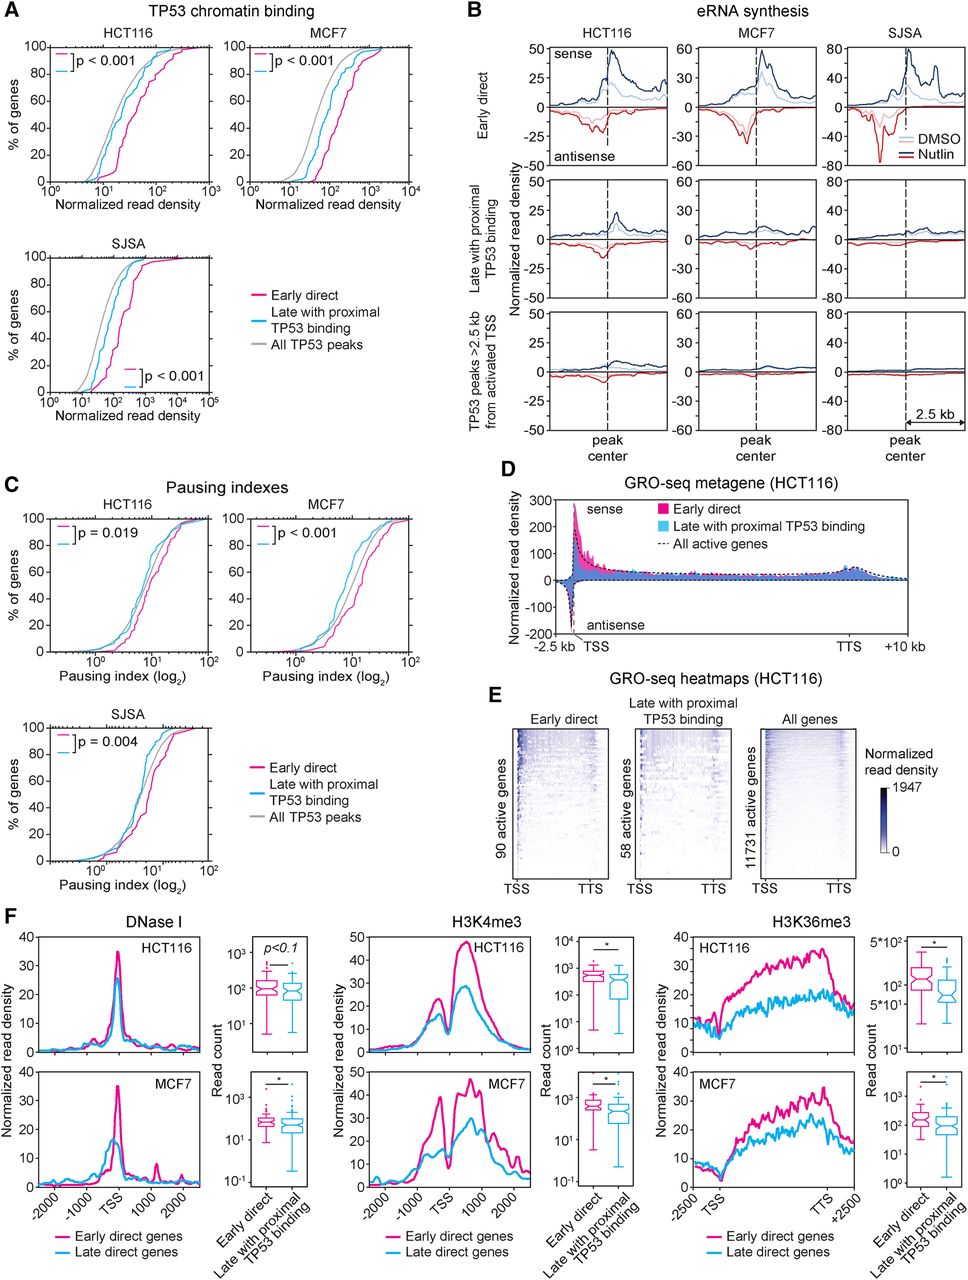
Early and late TP53 target genes display distinct regulatory features. (A) Cumulative distribution plots of TP53 ChIP-seq peak read densities for TP53 binding events within 25 kb of the transcription start site of early direct targets (magenta), late targets with proximal binding (turquoise), and all TP53 peaks across the genome (gray). Statistics: Mann-Whitney U test. (B) Metaprofiles of GRO-seq signals within 2.5 kb from the TP53 ChIP-seq peaks associated with genes in the indicated categories. Normalized read density represents GRO-seq reads per bp per 10 million mapped reads. (C) Cumulative distribution plots of RNA polymerase pausing indexes for transcriptionally active genes in the indicated categories in HCT116 cells. Statistics: Mann-Whitney U test. (D) Metagene profiles showing GRO-seq signal distribution at direct early versus late targets with proximal binding, in comparison to all transcriptionally active genes in vehicle (DMSO)-treated HCT116 cells. Normalized read density represents GRO-seq reads per bp per 10 million mapped reads, adjusted for gene length. (E) Heat maps displaying GRO-seq signals (sense strand only) at active early direct targets, late targets with proximal binding, and all active genes in vehicle-treated HCT116 cells. Normalized read density represents GRO-seq reads per bp per 10 million mapped reads, adjusted for gene length. (F) Metagene profiles and box and whisker plots of DNase I sensitivity, H3K4 trimethylation, and H3K36 trimethylation at early direct targets and late targets with proximal TP53 binding. Data obtained from the ENCODE project. Statistics: Mann-Whitney U test, P < 0.01. See also Supplemental Figure S4.


