
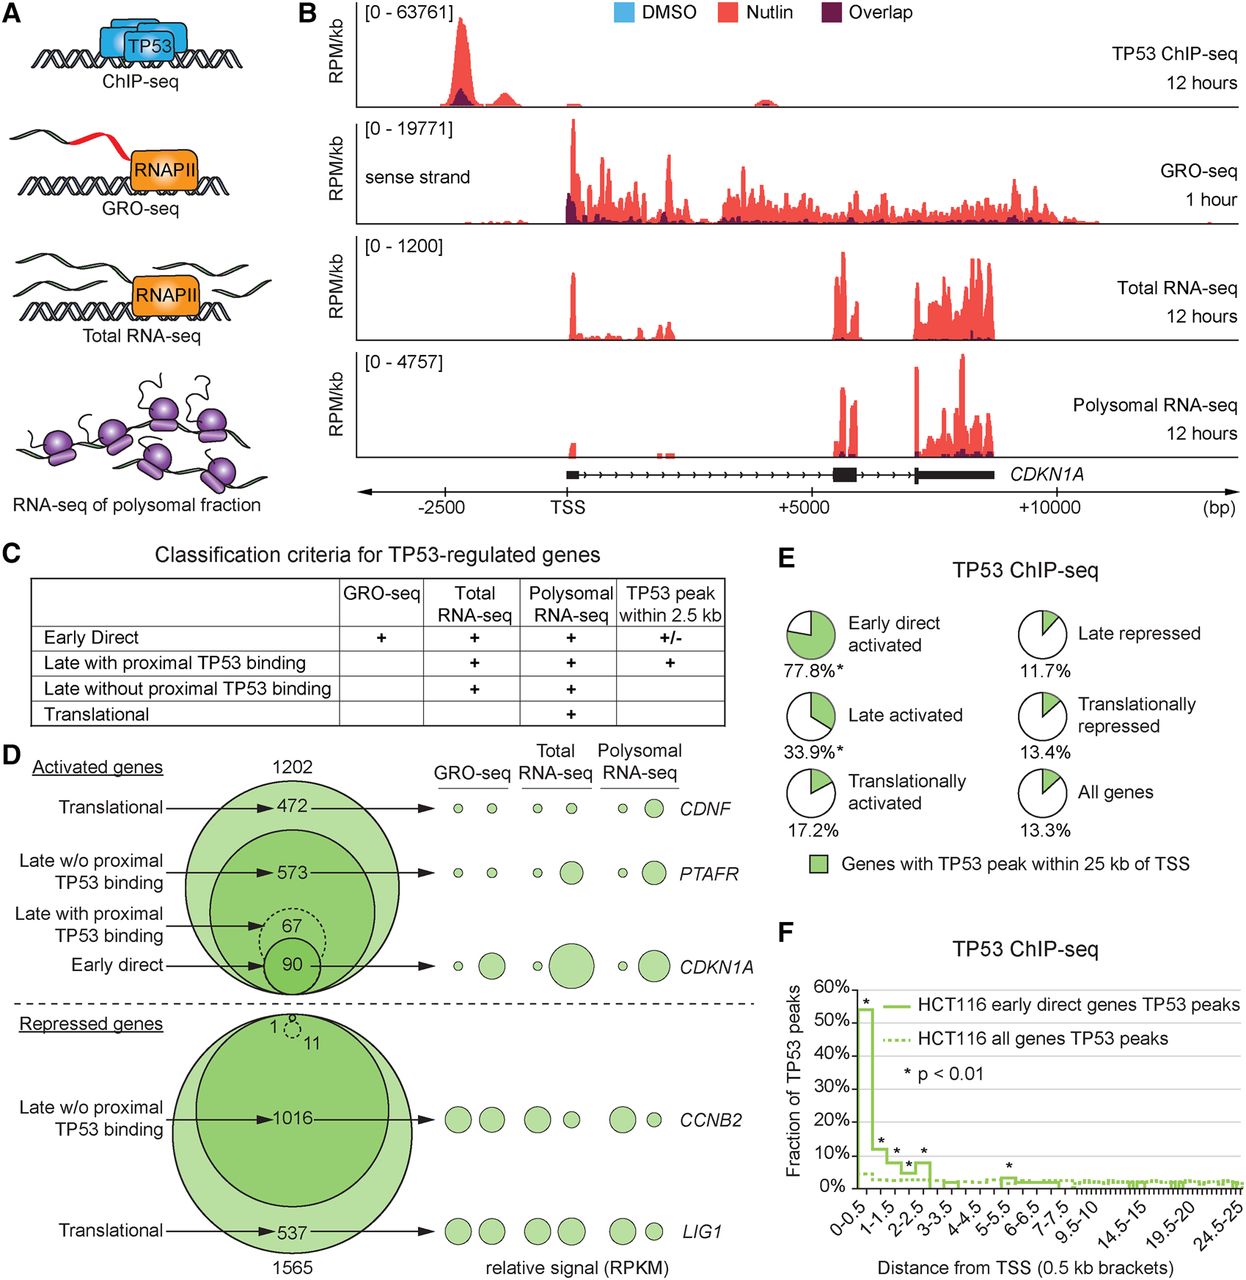
Multidimensional analysis of the TP53 network. (A) Schematic of the four data sets generated for identification of different classes of TP53-regulated genes. (B) Genome browser snapshots of the CDKN1A locus. HCT116 cells were treated with 10 µM Nutlin-3 or 0.2% DMSO (vehicle) for indicated times. (RPM/kb) Reads per million per kilobase, (TSS) transcription start site. (C) Summary of criteria used for classification of genes within the TP53 network. (D) Venn diagrams display the number of genes in each class following TP53 activation in HCT116 cells. Bubble plots show relative RPKM signals derived from GRO-seq and RNA-seq experiments for example genes regulated at different steps of the central dogma. See Supplemental Methods for details. (E) Pie charts show fractions of genes with a TP53 binding peak within 25 kb of the TSS in HCT116 cells. Asterisks indicate fractions where P < 0.01, using a χ2 test with Yates’ correction, compared to the “All genes” group. (F) Distribution of TP53 peaks within 25 kb of the TSS in 0.5-kb bins. Statistics: χ2 with Yates’ correction, P < 0.01. See also Supplemental Figure S1 and Supplemental Files S1–S5.


