
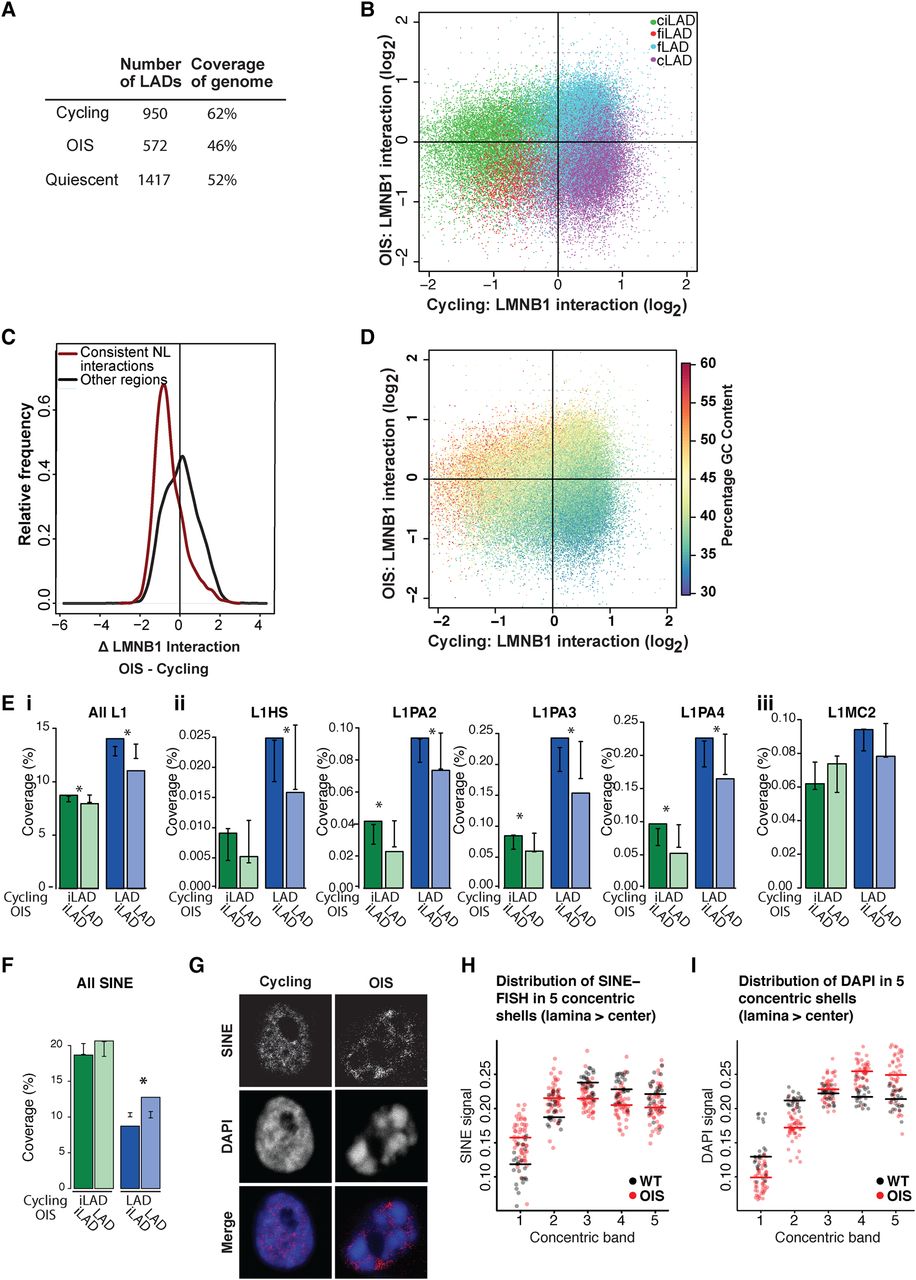
Loss of NL interactions during OIS affects primarily constitutive LADs. (A) LAD statistics in cycling, OIS cells, and quiescent cells. (B) Scatter plot representing the ratio of Dam-lamin B1 interaction within 50-kb windows for cycling (x-axis) and OIS cells (y-axis). The circles are colored according to their cLAD/ciLAD/fLAD/fiLAD status. cLADs (purple) show decreased NL binding in OIS cells. (C) Density plot of the change in LMNB1 interaction for consistent NL interactions compared to regions without consistent interactions. (D) Scatter plot showing LMNB1 binding ratio in cycling (x-axis) versus LMNB1 binding ratio in OIS cells (y-axis) in 50-kb windows. The circles are colored according to the percentage of GC content. (E,F) Repeat element coverage in LADs or iLADs in cycling cells after OIS: (green) repeat element coverage of iLADs in cycling cells that are still in iLADs in OIS cells (dark green) or moved to the NL in OIS cells (light green); (blue) repeat element coverage of LADs in cycling cells that detach from the NL in OIS cells (dark blue) or are still at the NL in OIS cells (light blue). (E) LINE-1 element coverage in LADs and iLADs: (i) all L1 elements; (ii) human- and primate-specific L1 repeats; (iii) L1MC2, a mammalian L1 repeat. Error bars indicate two standard deviations around mean L1 density for OIS LADs and iLADs randomly assigned to LAD or iLAD in OIS cells by circular permutations. Differences in iLAD and LAD L1 element density in OIS cells that was significantly different ([*] P < 0.05) to the expected density generated from random assignment of the LADs and iLADs in cycling cells. (F) SINE element coverage in LADs and iLADs. (G) Single z-section example of confocal images of cycling and OIS cells stained with a SINE probe (Alexa Fluor-555, grayscale). DNA was stained with DAPI. (H,I) Quantification of SINE (H) and DAPI (I) signal intensities in confocal sections, in five concentric shells having equal surface areas (shell 1 is closest to the NL, shell 5 is at the nuclear center). Each dot represents one nucleus; horizontal lines depict medians.


