
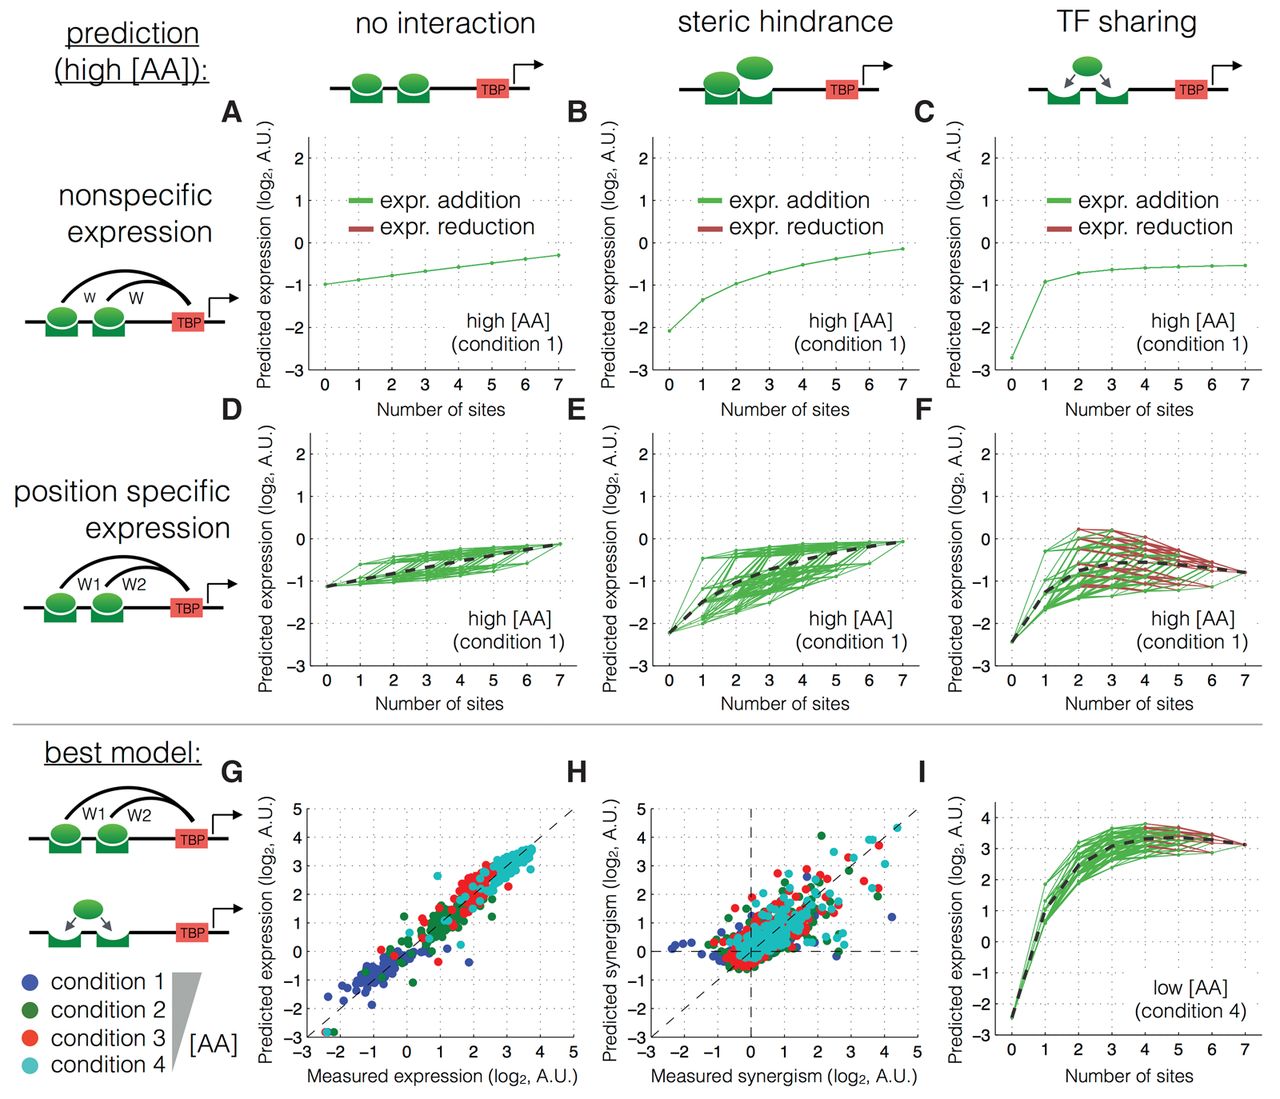
Figure 4.
TF sharing but not steric hindrance can explain the decrease in expression due to activator binding site addition. (A–F) Predicted expression as a function of binding site number for six different thermodynamic models, fitted in cross-validation to the Gcn4 measured data. Green lines show a predicted increase in expression upon binding site addition; red lines show a predicted decrease. R2 values were computed for absolute predicted expression on the test data. (G–I) Measured versus predicted expression and synergism for the best model at low and high [AA].


