
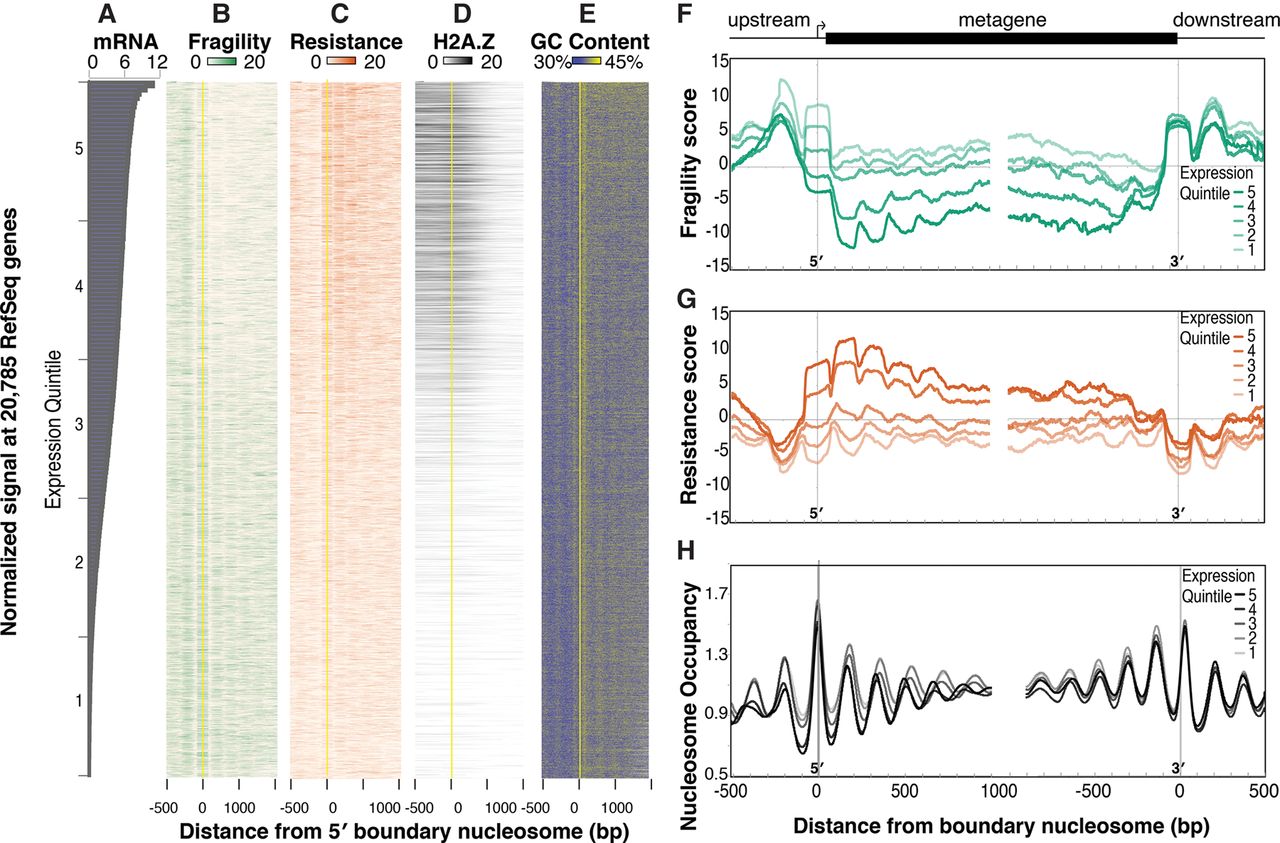
Fragility is enriched 5′ and 3′ of genes and is anti-correlated with gene expression. (A) Log2 DESeq2-normalized number of reads measured by mRNA-seq at 20,785 genes, ordered by their relative expression. (B) Heatmap of fragility scores (green) at genes ordered as in A. Genes were aligned at the center of the first nucleosome downstream from the transcript start site, known as the +1 or 5′ boundary nucleosome (yellow line). (C) Same as in B, except resistance scores are plotted in orange. (D) Same as B, except HTZ-1 input-normalized ChIP-seq signals (Ho et al. 2014) are plotted. (E) Same as B, except the average GC content (as a percentage of 100%) in 5-bp windows is plotted. (F–H) Fragility (F), resistance (G), and nucleosome occupancy (H) scores around the 5′ and 3′ boundary nucleosomes averaged over expression quintiles (highest expressed 20% in dark orange, dark green, or black; lowest expressed 20% in lightest orange, lightest green, or lightest gray). (Quintile 1) 0–4.5 normalized counts; (quintile 2) 4.5–65; (quintile 3) 65–619; (quintile 4) 619–2209; and (quintile 5) more than 2209.


