
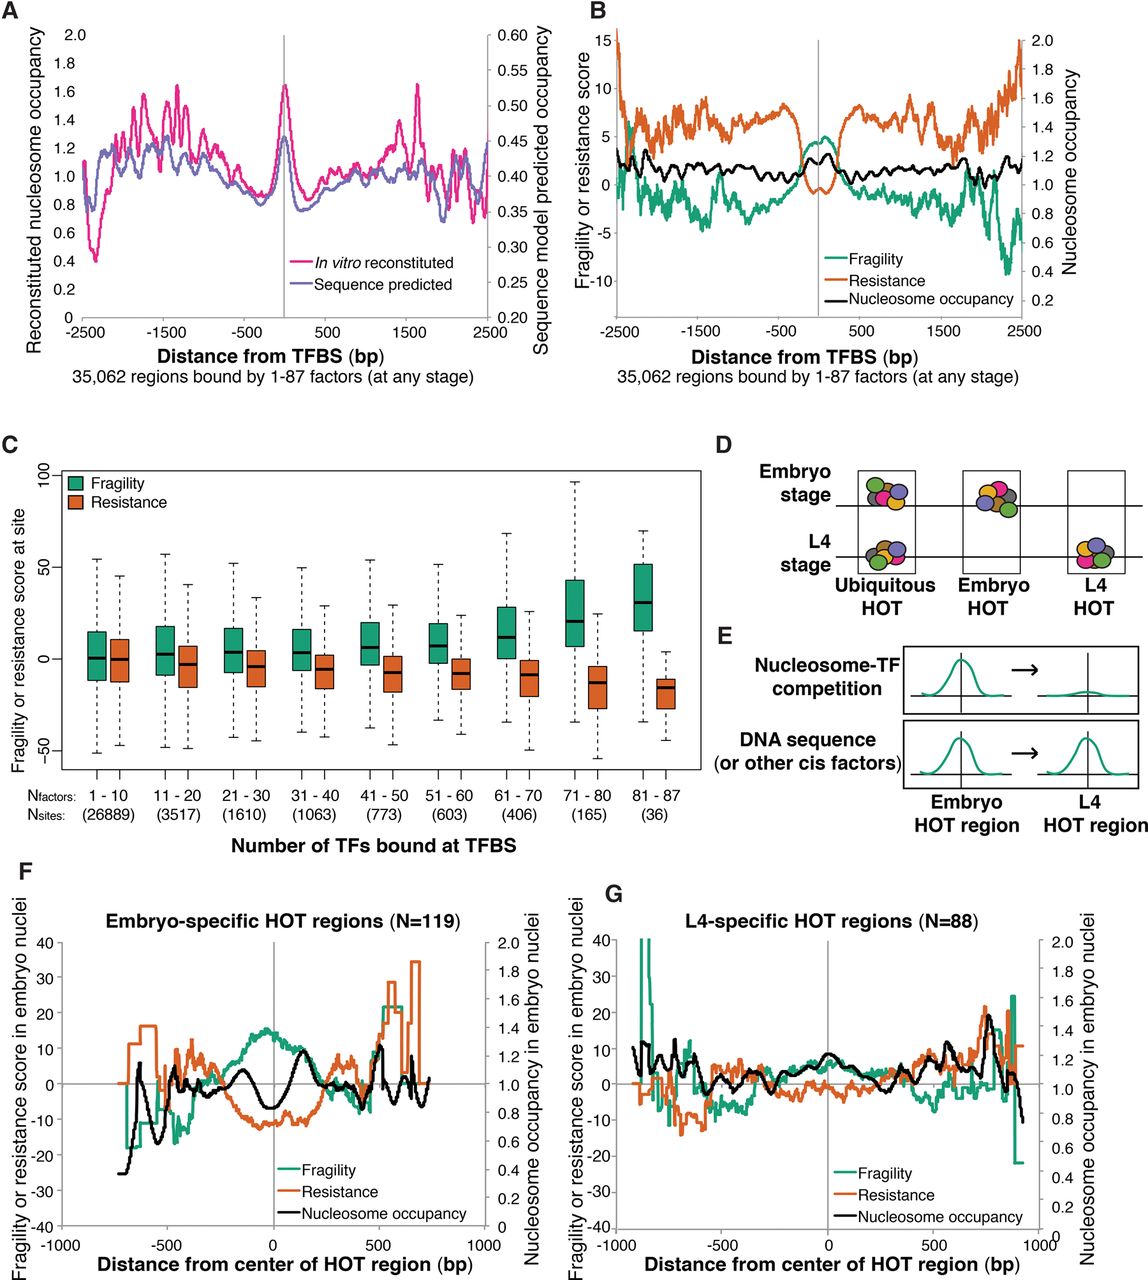
Competition with transcription factors influences nucleosome fragility. (A) Average reconstituted nucleosome occupancy (Locke et al. 2013) and computational nucleosome occupancy model scores (Kaplan et al. 2009) at 35,062 regions bound at any stage by any number of transcription factors. (B) Average fragility, resistance, and intermediate nucleosome occupancy scores are plotted around the same set of intervals from A. (C) Boxplot of average fragility or resistance scores at groups of sites bound by different numbers of transcription factors. Nfactors = number of transcription factors bound. Nsites = number of regions in each category. (D) Cartoon characterization of how embryo-specific and L4-specific HOT regions were identified. (E) Model to distinguish whether trans (top) or cis (bottom) effects result in nucleosome fragility at a given nucleosome in the embryo. Hypothetical fragility scores are represented. (F) Fragility, resistance, and nucleosome occupancy scores measured in the embryo at 119 embryo-specific HOT regions. (G) Fragility, resistance, and intermediate nucleosome occupancy scores at 88 L4-specific HOT regions.


