
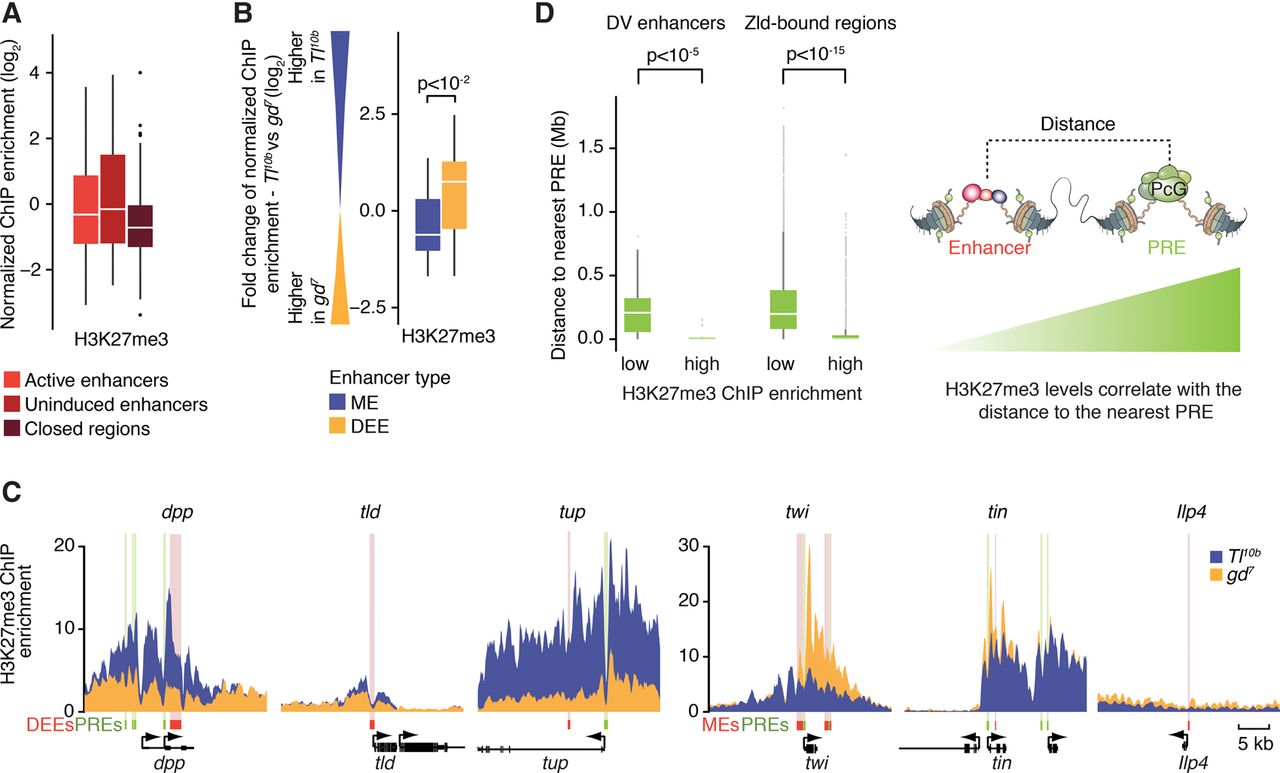
H3K27me3 levels are higher at uninduced enhancers but correlate more strongly with distance to the nearest PRE. (A) Boxplots show a wide range of different H3K27me3 levels at the different enhancer states, with no significant differences between them as determined by the Wilcoxon rank-sum test. (B) The fold-change difference in H3K27me3 enrichment between DV mutants shows that H3K27me3 at individual enhancers tends to be higher in the uninduced state versus active state. Significance was determined using the Wilcoxon rank-sum test. (C) H3K27me3 ChIP-seq enrichment profiles for three DEEs and three MEs illustrate clear differences between mutants (yellow vs. blue). H3K27me3 enrichment levels are highest near putative Polycomb response elements (PREs; green). Enhancers are shown as red boxes with pink shading. (D) Boxplots showing the distance of enhancers to the nearest PRE, dependent on whether they have low or high H3K27me3 enrichment levels. For DV enhancers with low H3K27me3 enrichment (below twofold enrichment, n = 39), the distances between enhancers and putative PREs are much larger than for those with high H3K27me3 levels (above twofold enrichment, n = 20). This is also true for Zld-bound regions, which include a large number of putative early Drosophila enhancers (low H3K27me3 n = 14,4425, high H3K27me3 n = 2720). Zld-bound regions are the union of Zld ChIP-seq peaks in Tl10b and gd7 with at least twofold enrichment in either tissue. Putative PREs are defined as the overlap between Pc and GAF regions (n = 602). Whiskers show 1.5 times the interquartile range, and outliers are shown as dots.


