
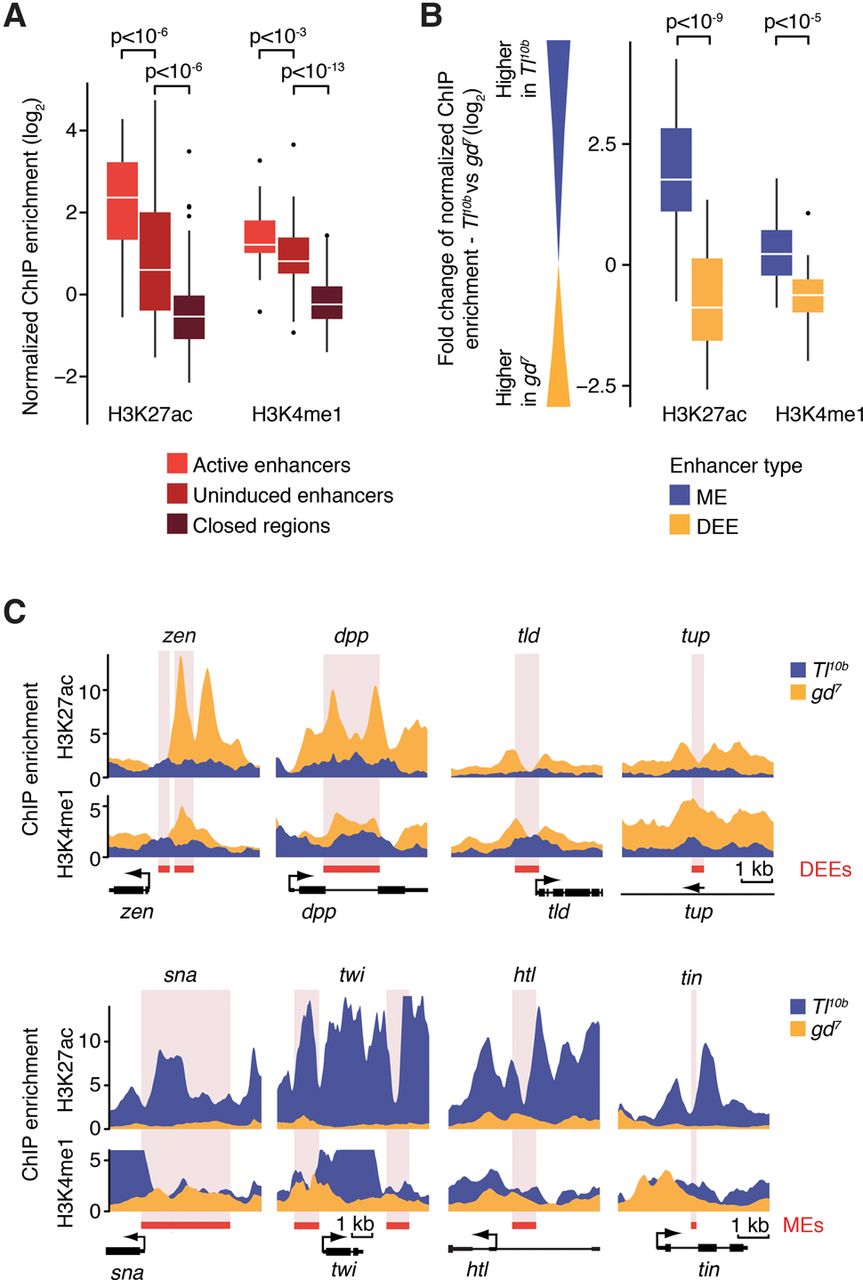
The histone modifications at uninduced enhancers resemble the poised enhancer signature. (A) Boxplots of normalized H3K27ac and H3K4me1 ChIP-seq enrichments show that all uninduced DV enhancers (n = 59, from both mutants) have lower H3K27ac enrichment levels than the same enhancers in the active state, yet the levels of H3K4me1 are significantly above closed regions (n = 100, same as in Fig. 1B), consistent with a poised enhancer signature. Whiskers show 1.5 times the interquartile range, and outliers are shown as dots. Significance between enhancer groups was determined using the Wilcoxon rank-sum test. (B) Boxplots of the fold-change of normalized histone modification ChIP-seq enrichments between mutant embryos show that H3K27ac and H3K4me1 levels are higher at active enhancers versus uninduced enhancers: The majority of MEs (blue) have higher H3K27ac enrichment in the Tl10b mutant than in the gd7 mutant (thus log2 Tl10b − log2 gd7 above 0), while the inverse is true for dorsal ectodermal enhancers (DEEs; yellow). Significance between MEs and DEEs was determined using the Wilcoxon rank-sum test. (C) Binding profiles of histone modification ChIP-seq enrichments show higher enrichment of H3K27ac and H3K4me1 when the enhancer is active. At the four DEEs, the levels are higher in gd7 (yellow), while at four MEs, the levels are higher in Tl10b (blue). The red box and the pink shading show the position of the enhancers, and the black arrow indicates the position and orientation of transcription start sites. The 1 kb scale bar shown for the tin region also applies to the sna and htl region.


