
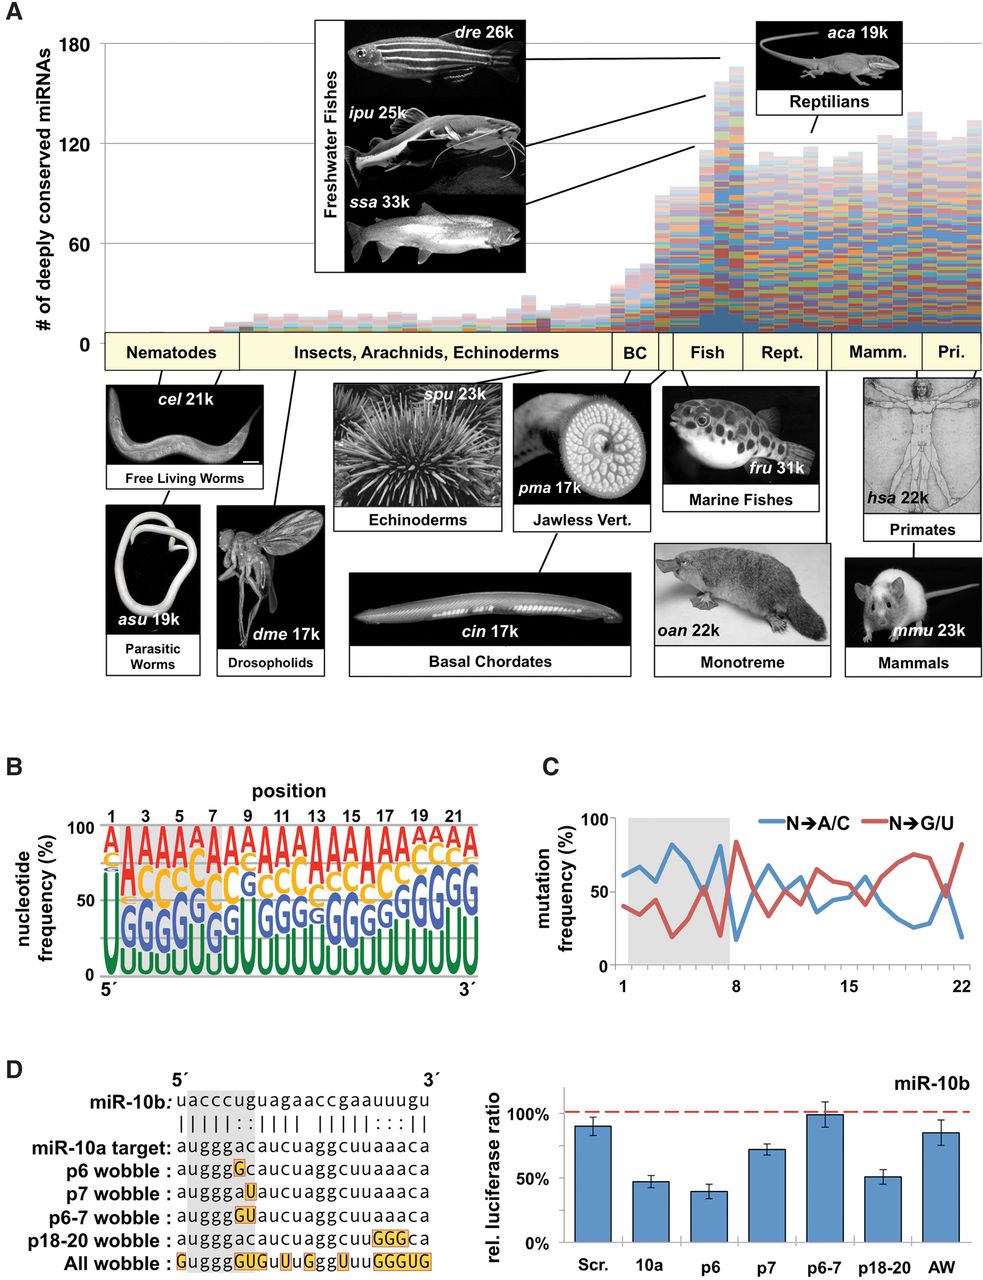
The evolution of highly conserved miRNA families reveals functional signatures. (A) We downloaded all metazoan pre-miRNAs and mature miRNAs from miRBase and identified 62 miRNA families that contain the most members in metazoans. Plotted are the raw numbers of pre-miRNAs in each species, with each colored bar representing a single miRNA family. Images represent the prominent model organism in each major phylogenetic grouping. Numbers on each image represent approximate number of protein coding genes. (B) Nucleotide content by position of the mature miRNA strand for all conserved miRNA families within metazoans. Data represent 3685 miRNAs from 62 different families in all metazoans. Relative position is based on the most frequent 5′ nucleotide from sequencing data. Seed region is marked with a gray box. (C) We measured the specific mutation frequency of specific nucleotides away from the conserved base in the family, toward either A/C or G/U. (D) Various permutations of the miR-10a complementary sequence were cloned into the SV40 3′ UTR (left). Gold boxes mark wobble nucleotides in targets, each of which was tested for repression by miR-10b in dual luciferase assays in HEK293T cells (right). Repression was measured as the change in relative luciferase ratio in response to miRNA cotransfection. Values were normalized to a negative miRNA control (dashed line) (n = 3). All error bars are SEM unless otherwise noted. (Scr.) Scrambled sequence; (10a) miR-10a; (AW) all wobble.


