
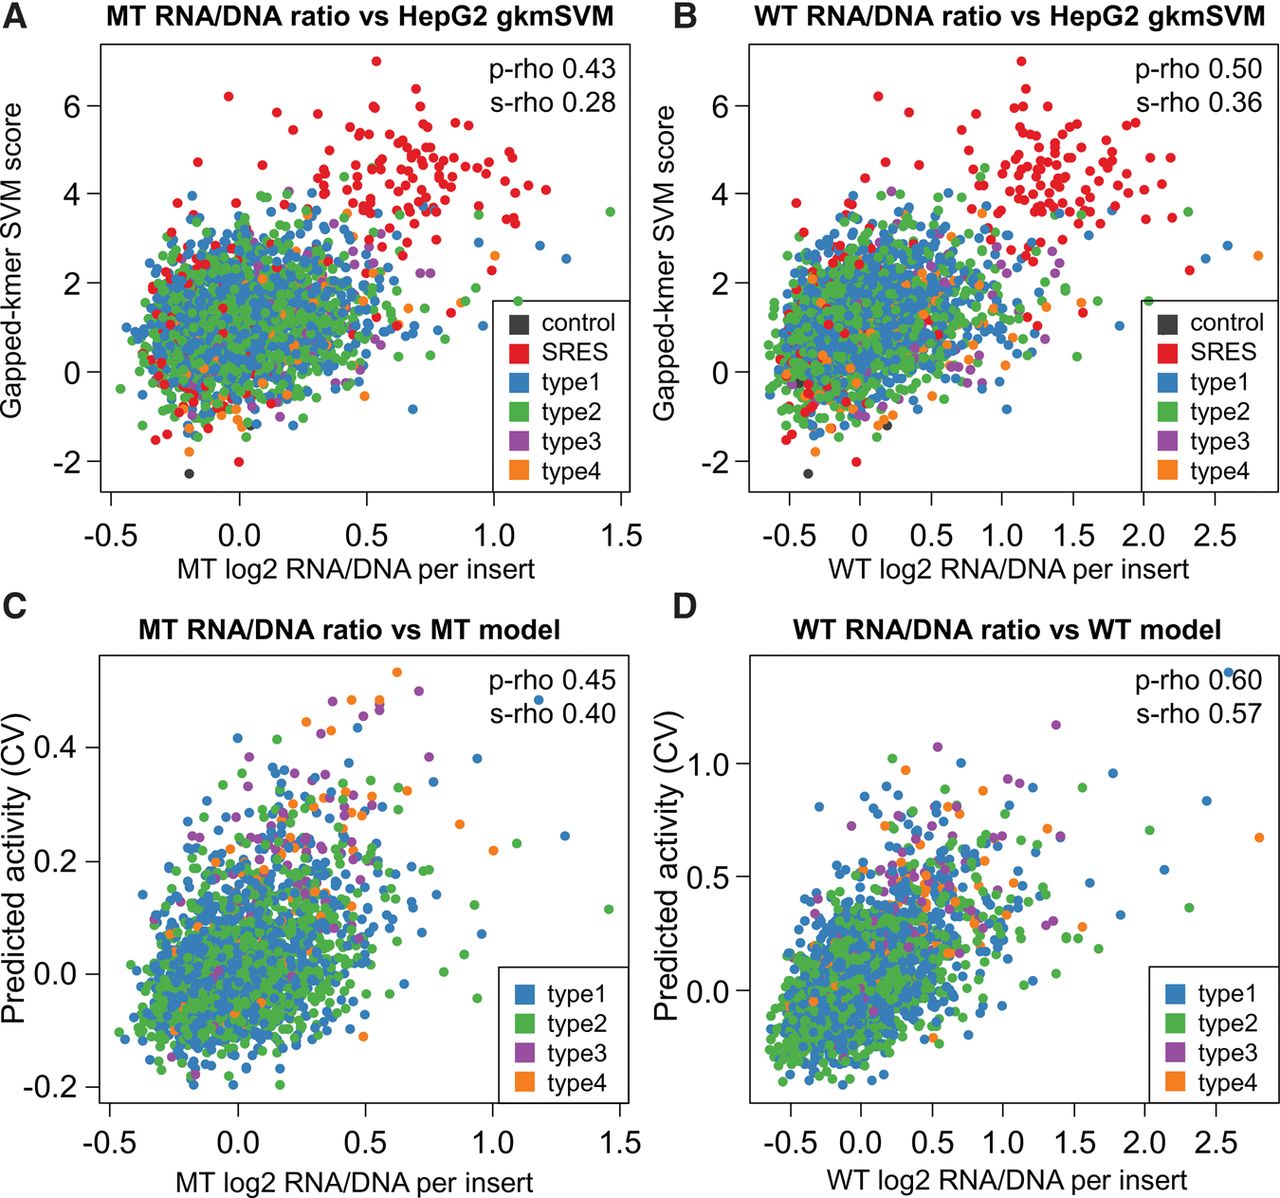
Prediction models. (A,B) Correlation of gkm-SVM scores obtained for a combined HepG2 model with RNA/DNA ratios obtained from the mutant (MT) and wild-type integrase (WT) experiments. Data points are colored by the type of insert sequence, including two types of controls: 200 synthetic regulatory element sequences (SRES, red) identified by Smith et al. (2013), and four other control sequences (dark gray). The four classes of putative enhancer elements are the following: (type 1) regions of FOXA1, FOXA2, or HNF4A binding that overlap H3K27ac and EP300 calls as well as at least one of three factors RAD21, CHD2, or SMC3; (type 2) regions like in type 1 but with RAD21, CHD2, or SMC3; (type 3) EP300 peak regions overlapping H3K27ac as well as at least one overlap with RAD21, CHD2, or SMC3, but without peaks in FOXA1, FOXA2, or HNF4A; (type 4) regions like in type 3 but with no remodeling factor overlapping. Correlations are partially driven by the SRES; when excluding all controls, Spearman's R2 values drop from 0.080 to 0.039 and from 0.128 to 0.076 for MT and WT, respectively. (C,D) Scatter plots of measured RNA/DNA ratios with predicted activity from linear Lasso models using annotations (numerical and categorical) as well as sequence-based (individual LS-GKM scores) information. Correlation coefficients are 0.45 Pearson/0.40 Spearman for the nonintegrated experiment (MT) and 0.60 Pearson/0.57 Spearman for the integrated constructs (WT). The models selected 110 (MT) and 133 (WT) of a total of 384 annotation features. Based on Pearson R2 values, these combined models explain 20.6% (MT) and 36.2% (WT) of the variance observed in these experiments.


