
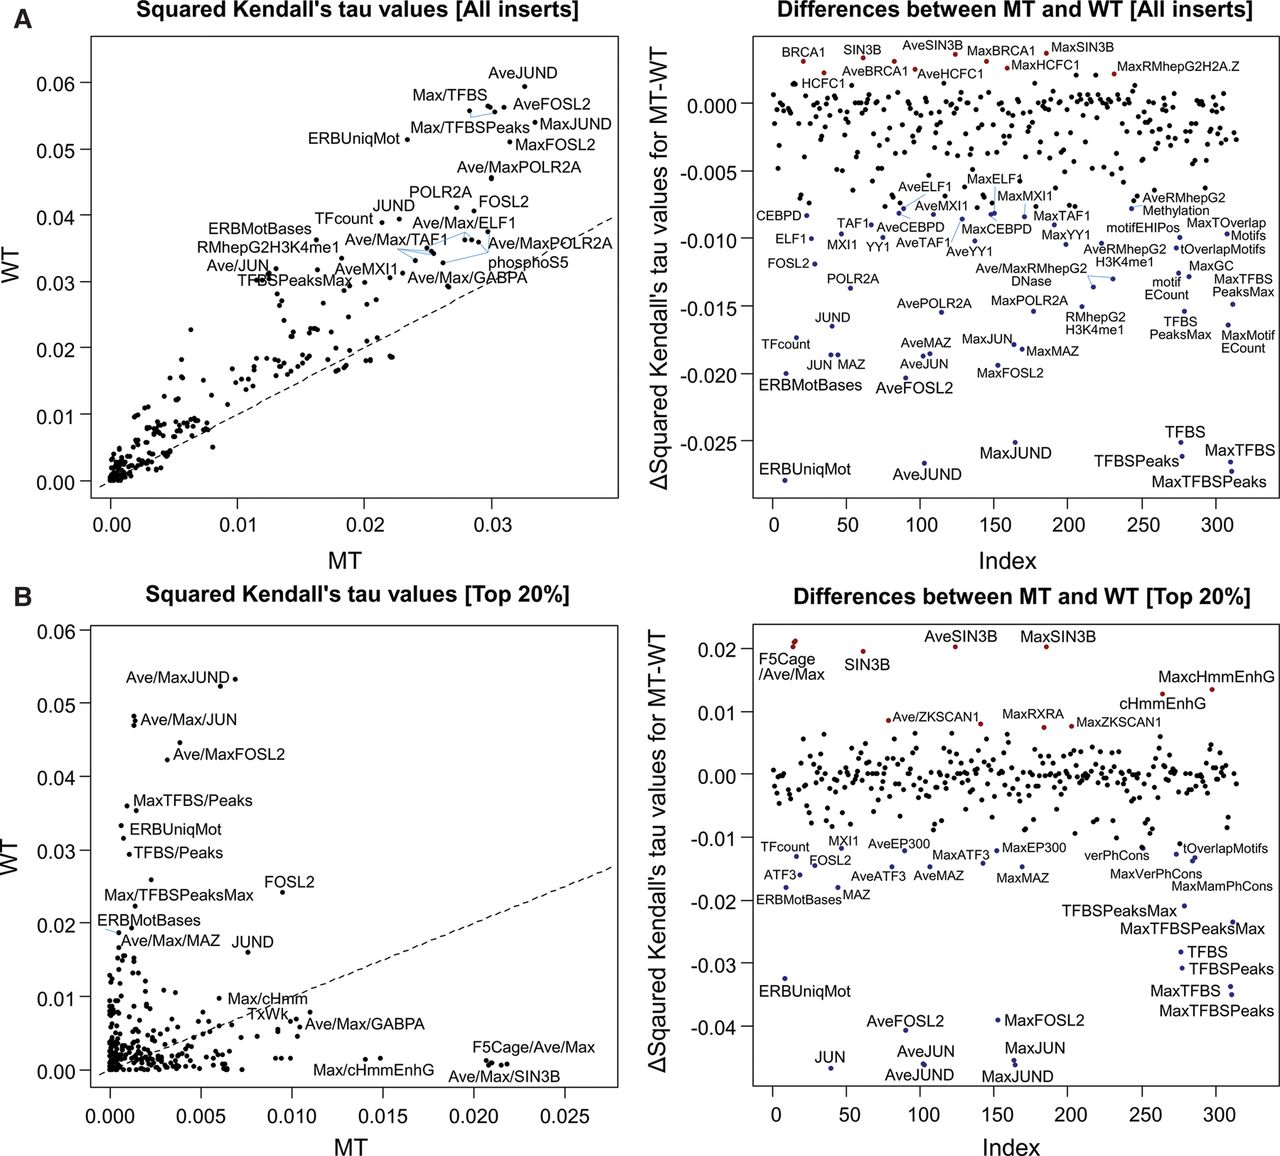
Figure 4.
Squared Kendall's tau (T2) values for available genome annotations for predicting the activity of candidate enhancer sequences in the nonintegrating (MT) and integrating (WT) experiments. (A) WT RNA/DNA ratios correlate better with annotations than the respective MT values. The left panel highlights the top correlated annotations for WT and MT ratios. The right panel highlights annotations with the largest difference in T2 values between the MT and WT experiments. (B) Same analysis for the 20% most active elements (Supplemental Table S1).


