
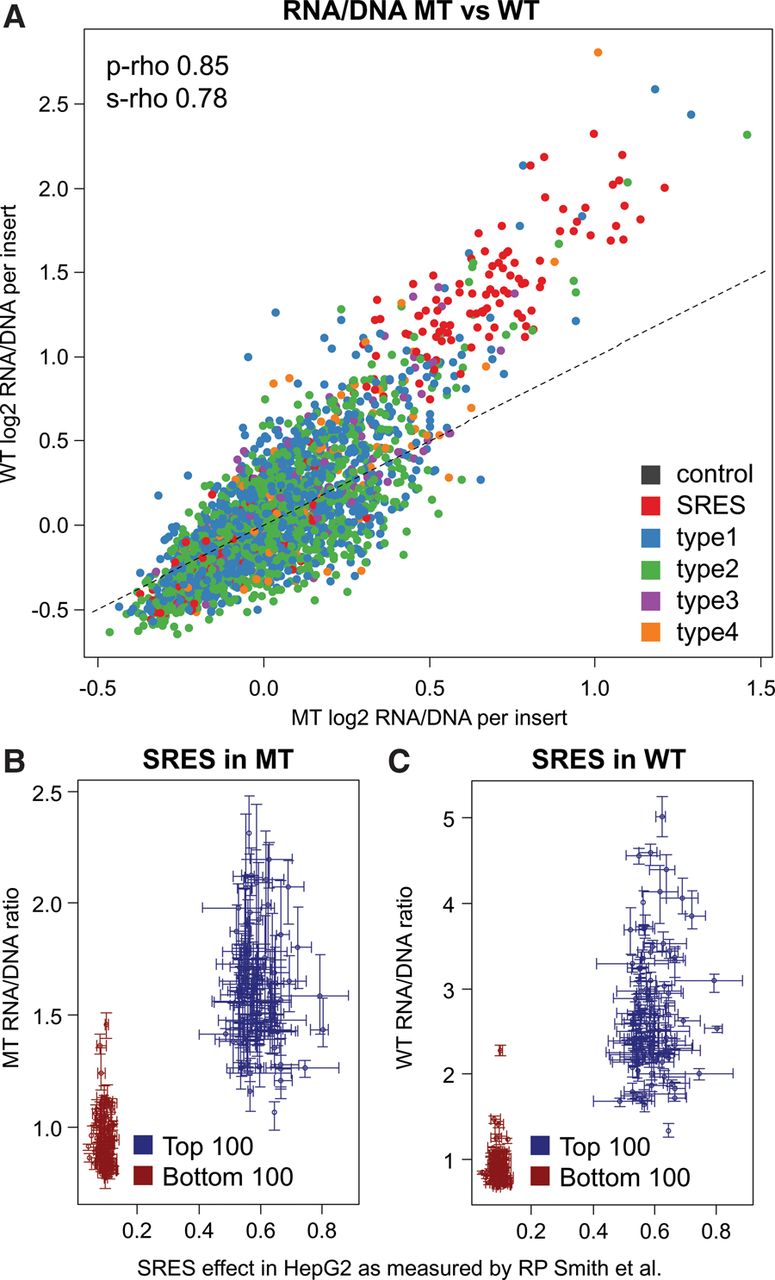
Comparisons between the nonintegrating (MT) and integrating (WT) libraries. (A) Scatter plot of combined MT versus WT RNA/DNA ratios. MT ratios show a smaller dynamic range and thus seem compressed compared to WT results. Data points are colored by the type of insert sequence, including two types of controls: a total of four positive and negative controls (black) as well as the highest 100 and lowest 100 synthetic regulatory element sequences (SRES, red) identified by Smith et al. (2013). The four classes of putative enhancer elements are the following: regions of FOXA1, FOXA2, or HNF4A binding that overlap H3K27ac and EP300 calls as well as at least one of three factors RAD21, CHD2, or SMC3 (type 1); regions like in type 1 but with no RAD21, CHD2, or SMC3 overlapping (type 2); EP300 peak regions overlapping H3K27ac as well as at least one overlap with RAD21, CHD2, or SMC3, but without peaks in FOXA1, FOXA2, or HNF4A (type 3); regions like in type 3 but with no RAD21, CHD2, or SMC3 overlapping (type 4). As shown here and in Supplemental Figure S11, we do not observe major differences between the four design types, either with respect to activity or MT versus WT. (B,C) Enhancer activity of 200 synthetic regulatory element sequences (SRES) in the MT (B) and WT experiments (C). Scatter plot of RNA/DNA ratios for the top 100 positive and top 100 negative synthetic regulatory element (SRE) sequences in HepG2 experiments by Smith et al. (2013). Plots show the combined RNA/DNA ratios on the y-axis and measurements by Smith et al. (2013) on the x-axis. Intervals indicate the mean, minimum, and maximum values observed for three replicates performed with each experiment.


