
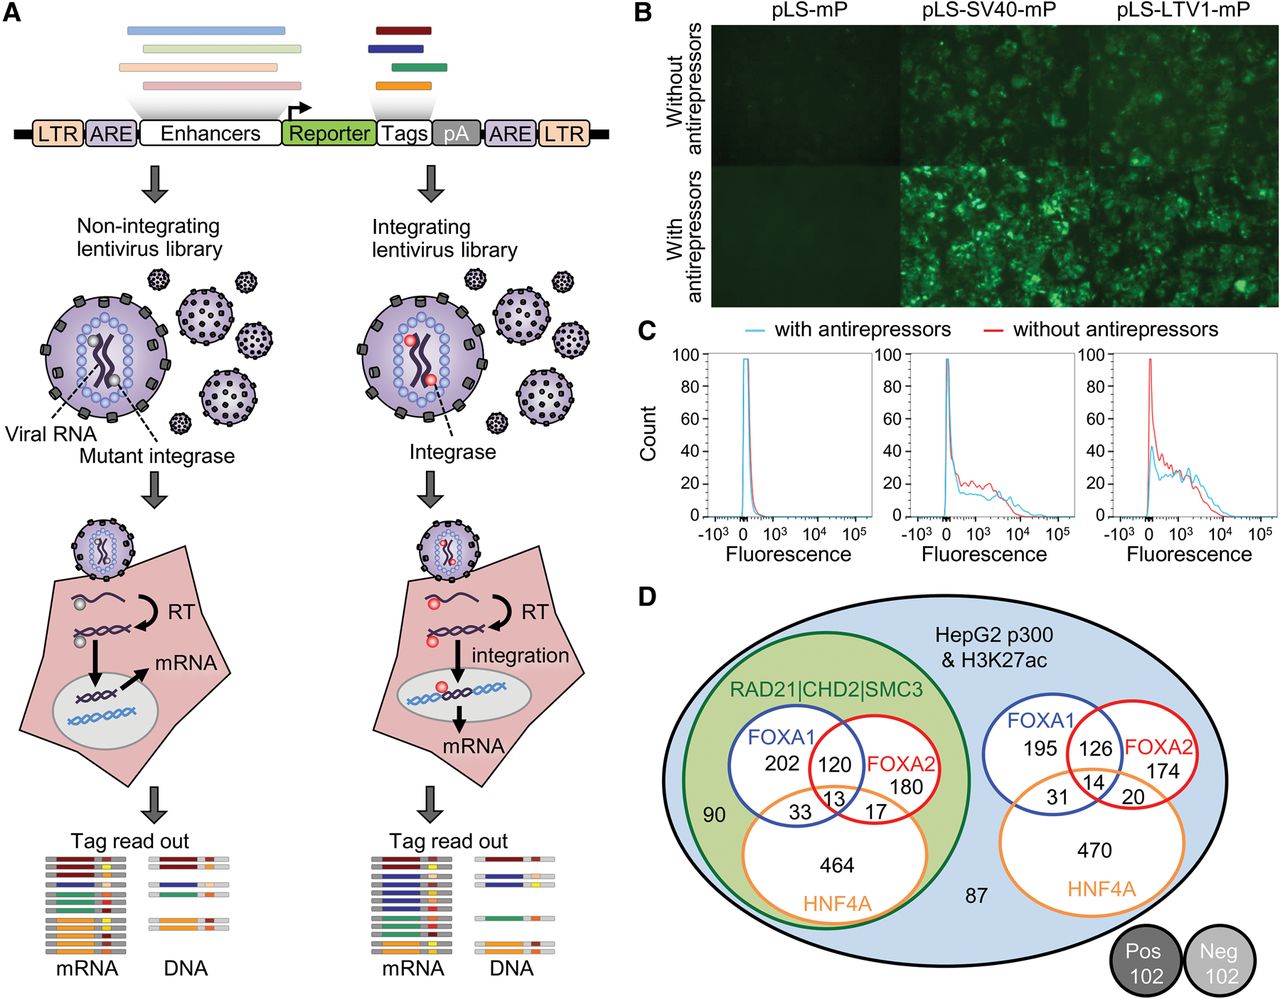
Study design for lentiMPRA. (A) Schematic diagram of lentiMPRA. Candidate enhancers and barcode tags were synthesized in tandem as a microarray-derived oligonucleotide library and cloned into the pLS-mP vector, followed by cloning of a minimal promoter (mP) and reporter (EGFP) between them. The resulting lentiMPRA library was packaged with either wild-type or mutant integrase and infected into HepG2 cells. Both DNA and mRNA were extracted, and the barcode tags were sequenced to test their enhancer activities in an episomal versus genome integrating manner. (B) HepG2 cells infected with lentiviral reporter construct bearing no enhancer (pLS-mP), an SV40 enhancer (pLS-SV40-mP), or Ltv1 (pLS-Ltv1-mP), a known liver enhancer (Patwardhan et al. 2012), with or without antirepressors. The inclusion of antirepressors results in stronger and more consistent expression, but is still dependent on the presence of an enhancer. (C) FACS analyses quantifying the fluorescence intensity of pLS-mP, pLS-SV40-mP, and pLS-Ltv1-mP with (blue lines) or without (red lines) antirepressors following infection into HepG2 with 1 copy of viral molecule per cell. Analysis of all GFP expressing cells (fluorescence more than 500 intensity units) shows a higher proportion of cells that strongly express GFP (more than 2000 units) when antirepressors are included. Specifically, 54.8% versus 45.1% for SV40, and 35.6% versus 29.0% for Ltv1, of cells with and without antirepressors, respectively. (D) Venn diagram showing the composition of the lentiMPRA library. Two thousand two hundred thirty-six enhancer candidate sequences were chosen on the basis of having ENCODE HepG2 ChIP-seq peaks for EP300 and H3K27ac marks. The candidates overlapped with or without ChIP-seq peaks for FOXA1, FOXA2, or HNF4A. Half the candidates overlapped with ChIP-seq peaks for RAD21, SMC3, and CHD2. In addition, the library included 102 positive and 102 negative controls.


