
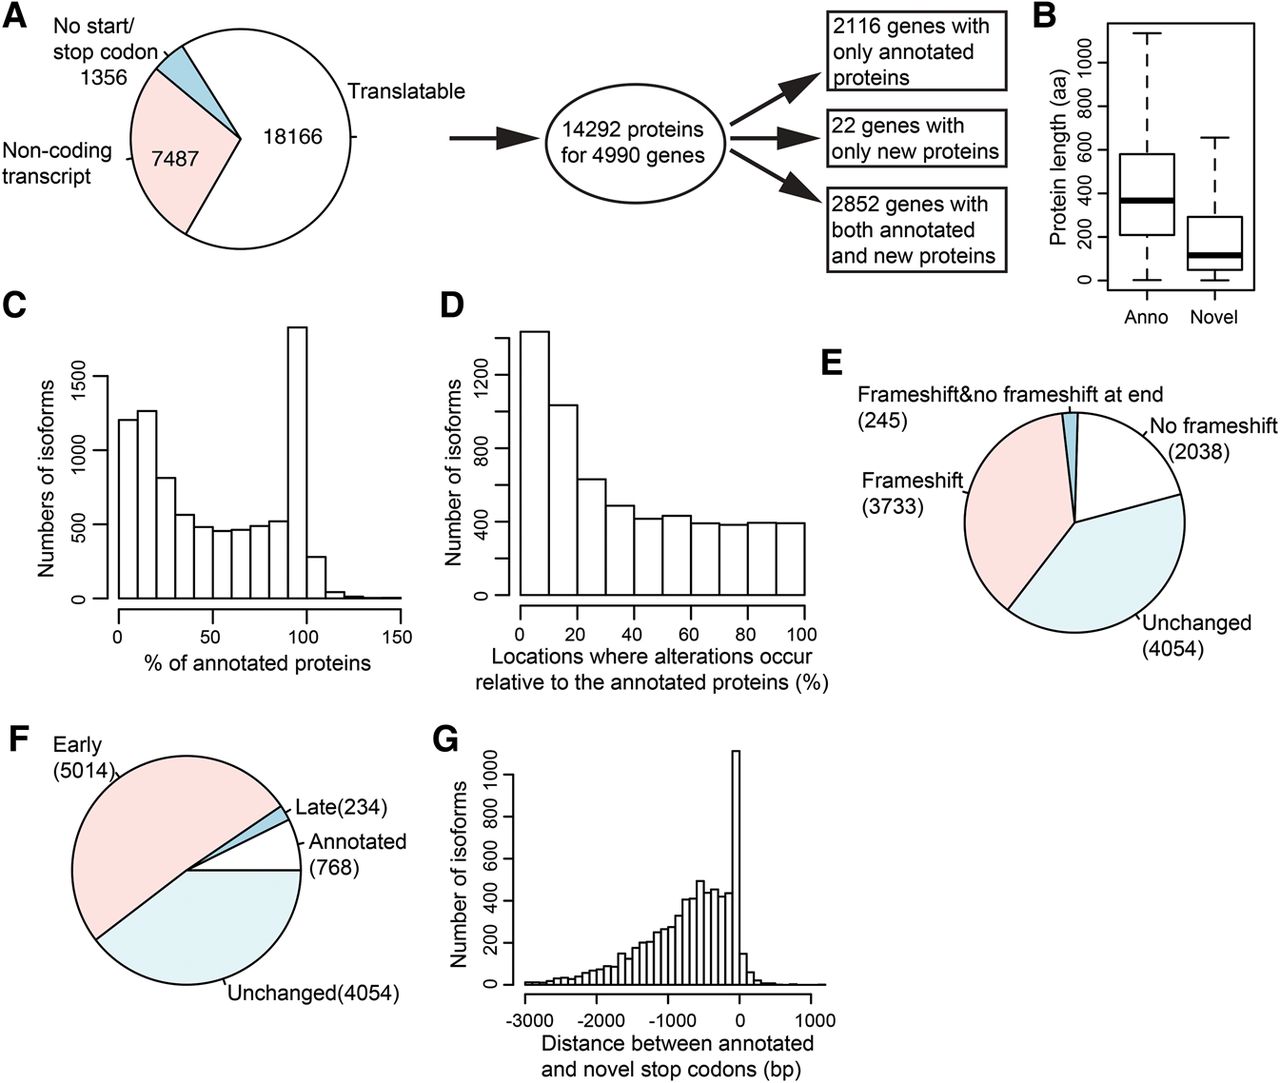
Predicting translational products from detected isoforms. (A) Summary of protein prediction. The left pie plot shows the number of translatable isoforms. From 4990 genes, 14,292 protein sequences were predicted, and these genes were further broken up by the status of annotated and new protein sequences. (B) Box plot indicating the length of annotated and novel protein sequences. (C) For isoforms encoding novel protein sequences, the histogram shows the ratio of the length of novel protein sequences relative to the length of the corresponding annotated protein sequence. (D) Histogram showing where alteration occurs in the predicted protein relative to the corresponding annotated protein. (E) Fractions of translatable isoforms with novel AS events which contain frameshift or not. Unchanged refers to AS isoforms with the same protein sequence as the annotated one. (F) Fractions of translatable isoforms with novel AS events which have early, late, or annotated stop codons. (G) Histogram showing the distances between annotated and novel stop codons for isoforms with novel predicted proteins.


