
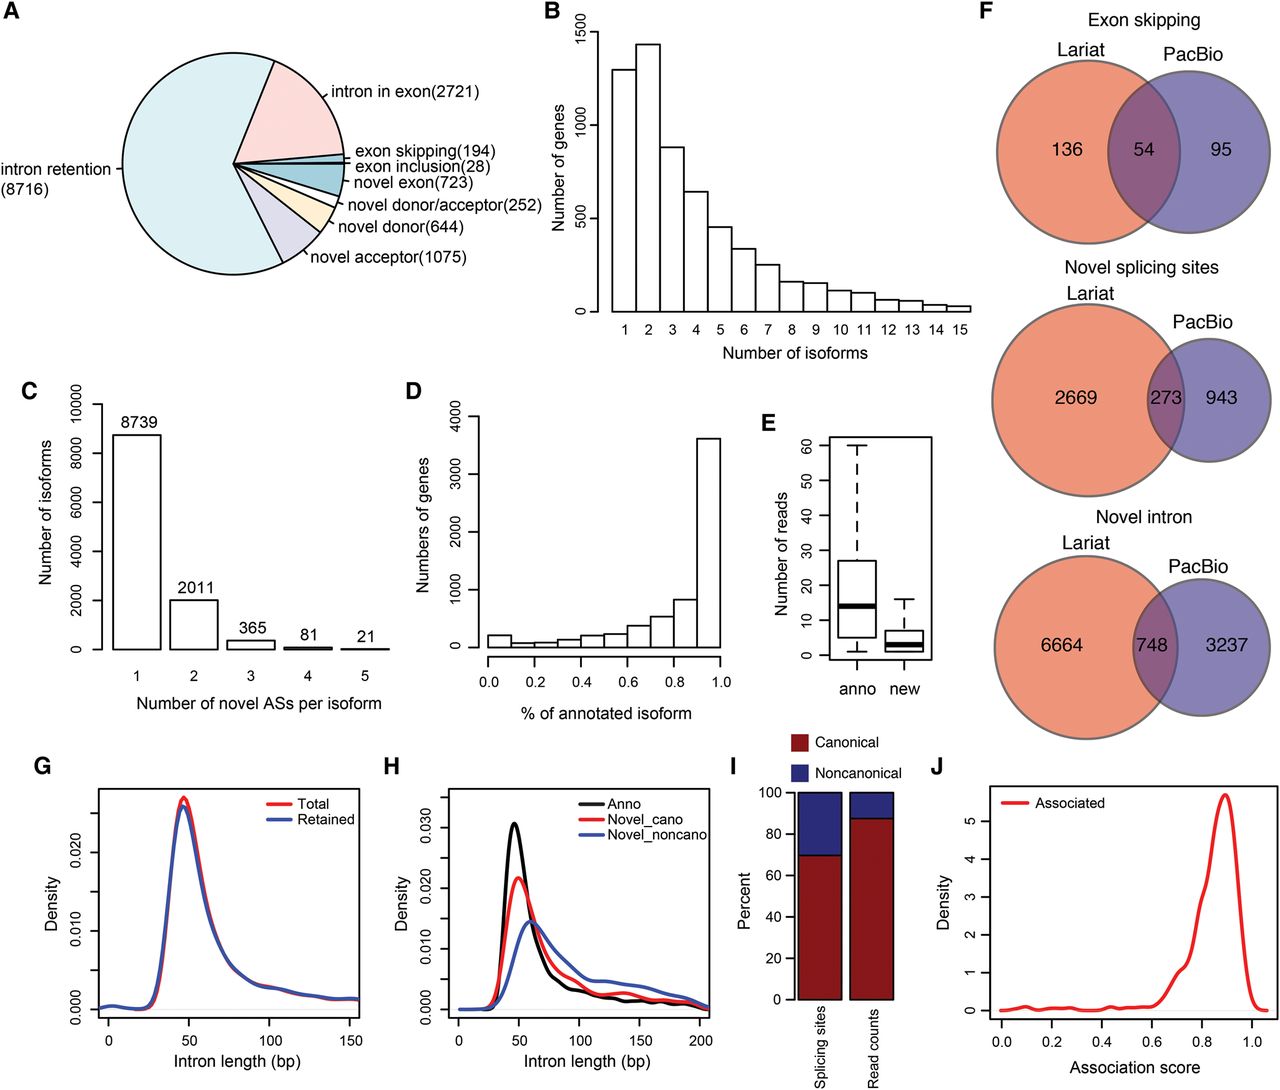
Landscape of alternative splicing events during S. pombe meiosis. (A) Pie chart showing the fraction of different types of alternative splicing events in S. pombe. Numbers of alternative splicing for each type are listed after the names. (B) Count of genes with different number of isoforms. (C) Isoforms broken up by the number of novel alternative splicing events discovered in individual isoforms. (D) Genes broken up by the percentage of FL CCS reads corresponding to the annotated isoforms. (E) Box plot showing the numbers of FL CCS reads supporting annotated and novel antisense transcripts. (F) Venn graphs showing the comparison between AS events detected by PacBio sequencing and lariat sequencing. (G) Length distribution of all annotated introns and of retained introns. (H) Length distribution of annotated introns, novel introns with canonical splicing sites, and novel introns with noncanonical splicing sites. (I) Fractions of canonical and noncanonical splicing sites (left) and of their supporting read counts (right). (J) Distribution of intra-genic association score for alternative intron pairs at FDR = 0.05.


