
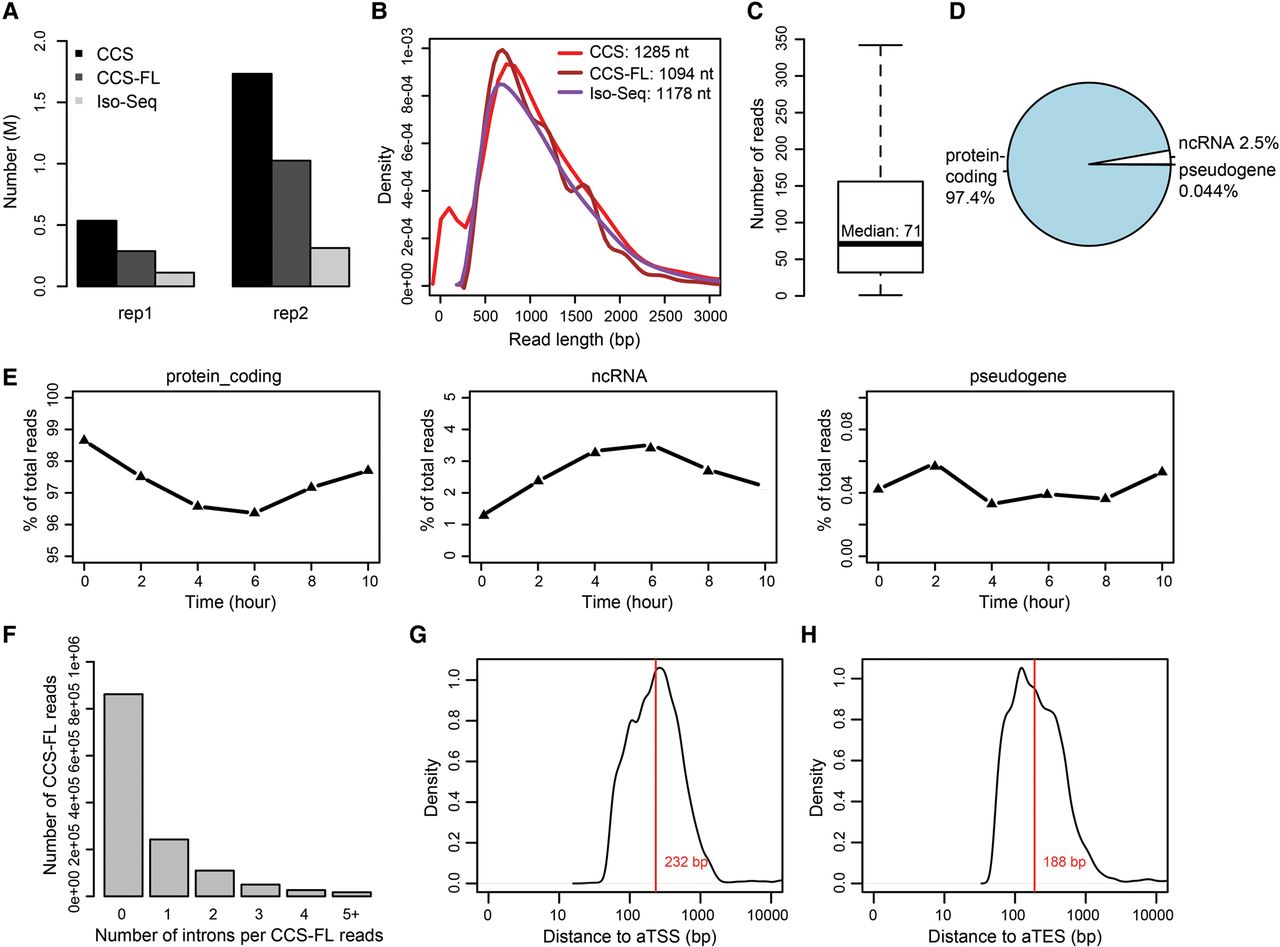
General properties of PacBio reads. (A) Numbers of CCS reads, full-length CCS reads (CCS-FL), and Iso-Seq reads from two replicates. The second batch has 4× size of the first batch. (B) Length distribution of CCS, CCS-FL, and Iso-Seq reads. (C) Box plot showing the 25th, 50th, and 75th percentiles of the numbers of FL CCS reads for each gene. Whiskers represent 1.5 inter-quartile range. (D) Pie plot showing the percentage of FL CCS reads corresponding to protein-coding genes, noncoding RNA genes, and pseudogenes. (E) Overall trends of FL CCS reads matching protein-coding genes, noncoding RNA genes, and pseudogenes. (F) Counts of FL CCS reads with different numbers of introns. (G) Distribution of distances between the 5′ end of reads to the annotated TSS sites (aTSSs). Reads only outside the annotated TSS sites were counted. (H) Distribution of distances between the 3′ end of reads to the annotated TES sites (aTESs). Reads only outside the annotated TES sites were counted.


