
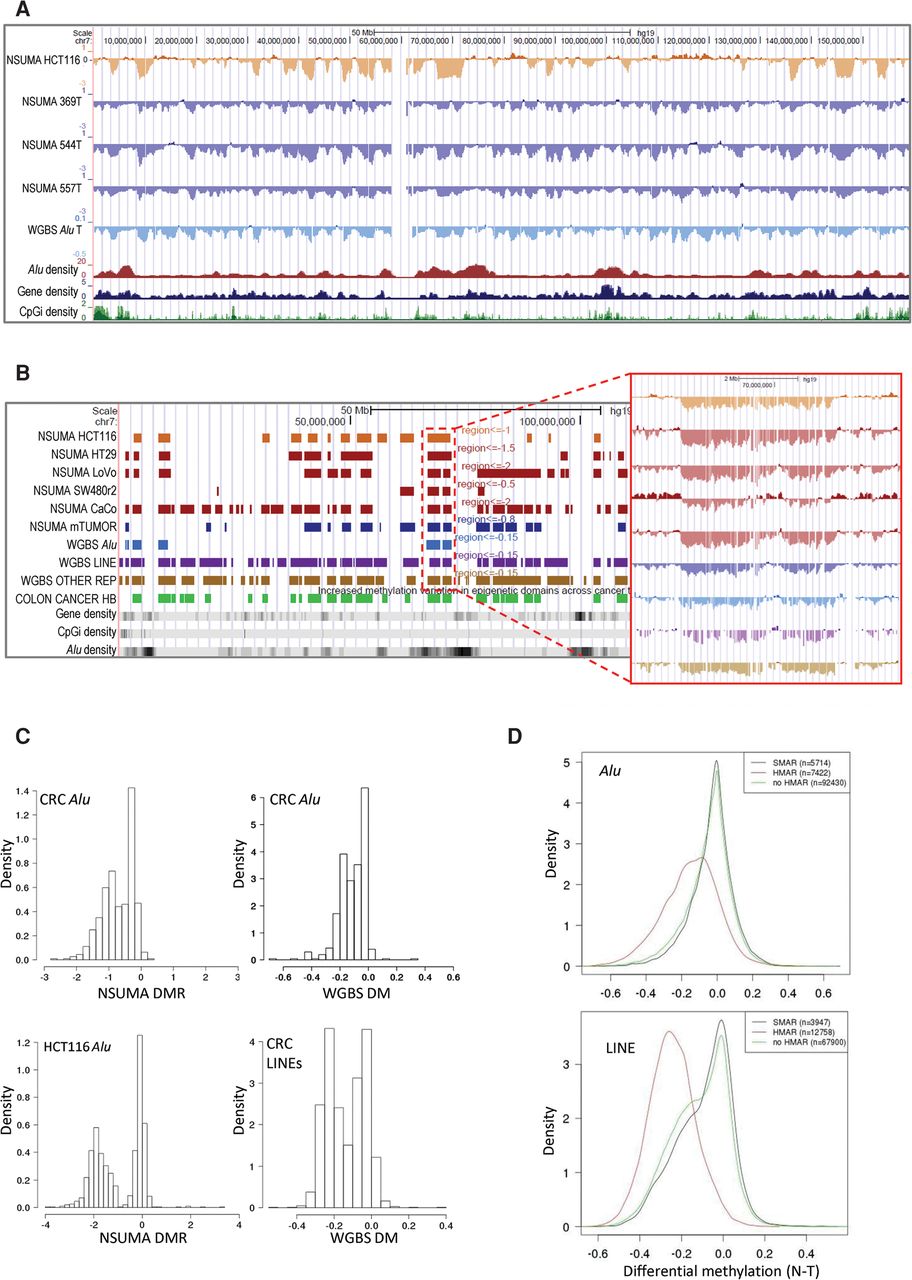
(A) Visualization of Chromosome 7 NSUMA Alu DMR for HCT116 and three colon cancer tumors (369T, 544T, and 557T) compared with their corresponding normal tissues (HCT116 was compared against the three normal samples). Values below 0 indicate hypomethylation in the tumor against the normal tissue. Additional tracks show the mean differential methylation of three colon tumors analyzed by WGBS (Hansen et al. 2011) and the density of Alu elements, genes, and CpG islands along the genome. (B) Hypomethylated regions obtained from NSUMA profiles in five colon cancer cell lines, and three primary colon cancers (mTUMOR). Hypomethylated regions obtained from WGBS in three colon cancers considering different repeat types (Alu, LINE, and other repeats). Additional tracks show the hypomethylated block (Colon Cancer HB) (Hansen et al. 2011) and the abundance of genes, CpG islands, and Alu repeats. The inset shows a detailed view of the differential methylation profiles in the region enclosed by a red dotted line. (C) Distribution of hypomethylated regions according to the mean differential methylation of Alu repeats determined by NSUMA and WGBS and LINEs determined by WGBS in colorectal cancers and HCT116 cell line. (D) Distribution of differential methylation in Alu (upper panel) and LINE (lower panel) repeat elements determined by WGBS in regard to the mean differential methylation of the enclosing region: HMAR, no HMAR, and SMAR.


