
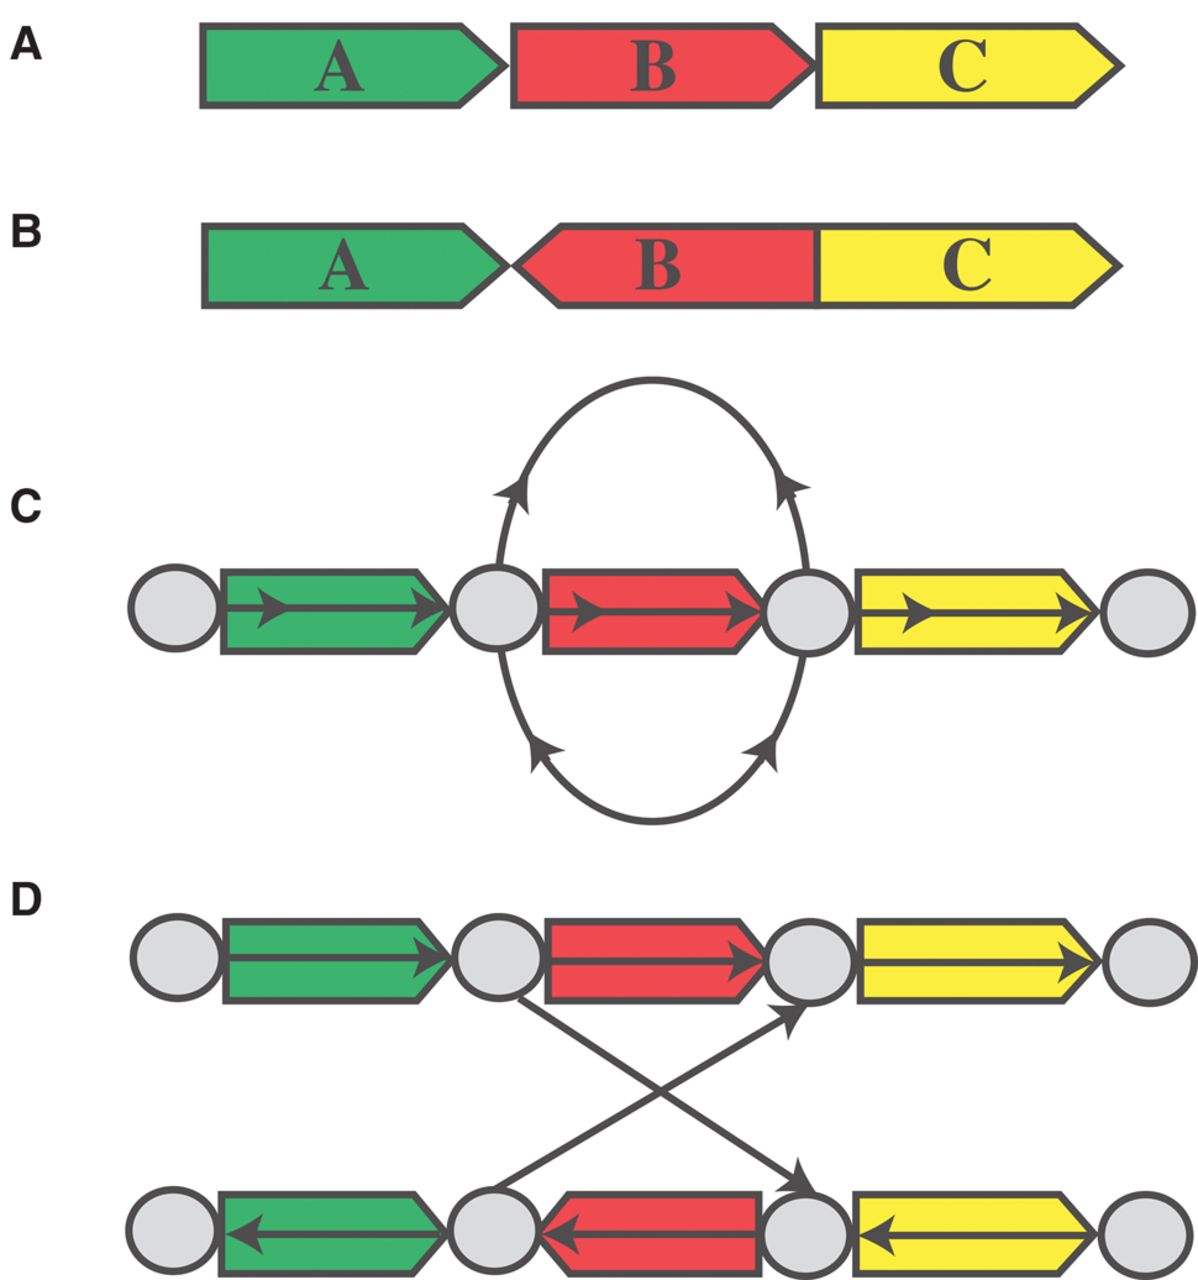
Figure 4.
Tumor adjacency graph. (A,B) Reference and tumor genome, respectively. (C) The bidirected graph representation of the tumor genome. (D) The directed graph equivalent to C.
(Downloading may take up to 30 seconds. If the slide opens in your browser, select File -> Save As to save it.)
Click on image to view larger version.
Tumor adjacency graph. (A,B) Reference and tumor genome, respectively. (C) The bidirected graph representation of the tumor genome. (D) The directed graph equivalent to C.
 CiteULike
 Delicious
 Digg
Digg Facebook
 Google+
 Reddit
 Twitter
