
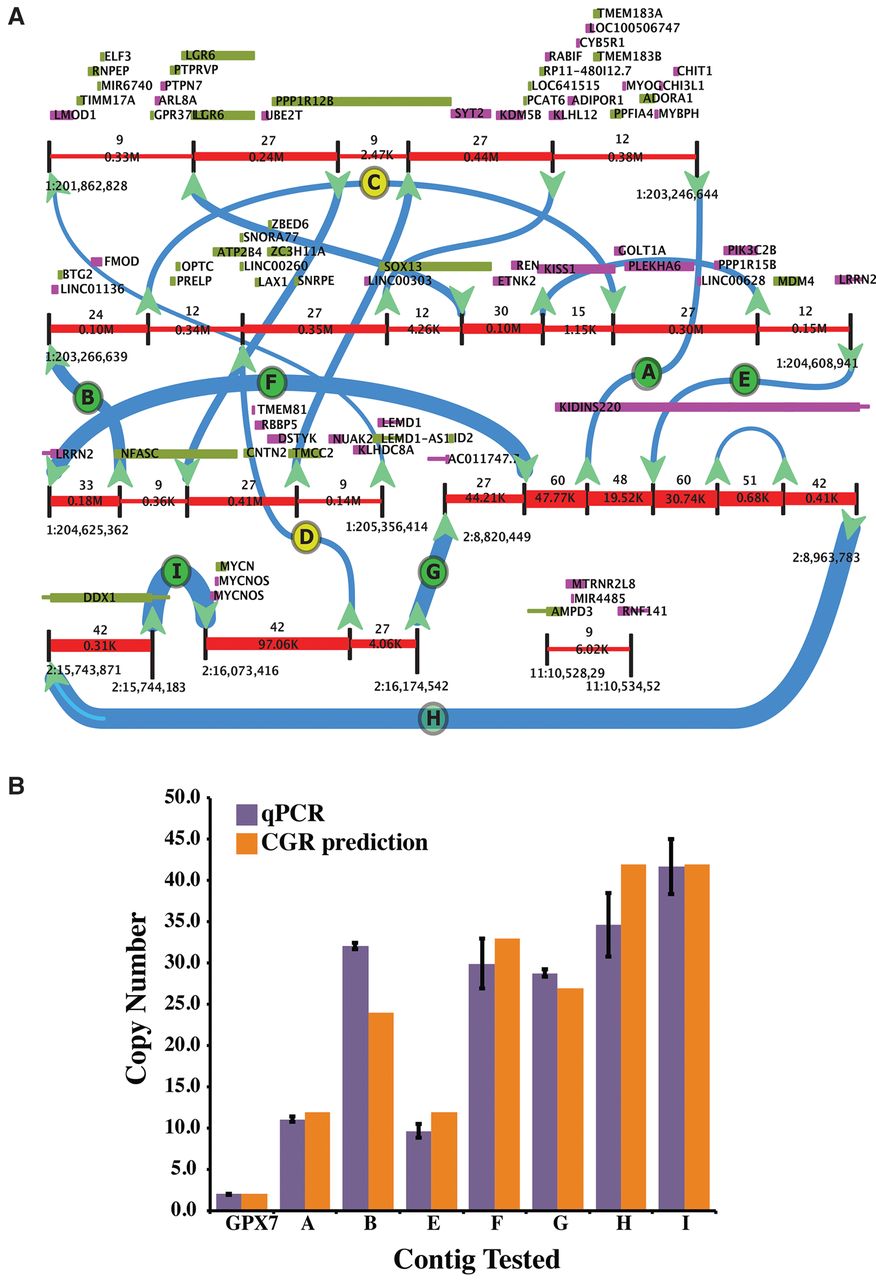
Analysis of DIPG29. (A) The predicted CGRs are convolved into a unique structure as visualized by CouGaR-Viz (the four contigs identified are illustrated in Supplemental Fig. S1). Genomic segments are represented by red lines and are interrupted by black vertical lines to show breakpoints. Directional arrows are used to show connections between the segments, and thickness of the arrows and red segments represent the identified copy counts. Genes overlapping the positive strand are depicted as green boxes and genes overlapping the negative strand are shown in purple. Breakpoints that were selected for testing are shown as letters (A–I) in circles. Here, green circles indicate breakpoints that were validated, and yellow circles indicate breakpoints that failed to validate. (B) Nine breakpoints were selected for validation, and for each of these, unique primers were designed and copy counts were estimated with qPCR. GPX7 gene was used as a control to normalize the counts. For seven of the positively tested breakpoints, the copy counts estimated by qPCR are shown in purple (error bars show standard deviation), and copy counts estimated by CouGaR are shown as orange bars. In all cases, the qPCR results match the predicted copy counts.


