
Abstract
The genomic alterations associated with cancers are numerous and varied, involving both isolated and large-scale complex genomic rearrangements (CGRs). Although the underlying mechanisms are not well understood, CGRs have been implicated in tumorigenesis. Here, we introduce CouGaR, a novel method for characterizing the genomic structure of amplified CGRs, leveraging both depth of coverage (DOC) and discordant pair-end mapping techniques. We applied our method to whole-genome sequencing (WGS) samples from The Cancer Genome Atlas and identify amplified CGRs in at least 5.2% (10+ copies) to 17.8% (6+ copies) of the samples. Furthermore, ∼95% of these amplified CGRs contain genes previously implicated in tumorigenesis, indicating the importance and widespread occurrence of CGRs in cancers. Additionally, CouGaR identified the occurrence of ‘chromoplexy’ in nearly 63% of all prostate cancer samples and 30% of all bladder cancer samples. To further validate the accuracy of our method, we experimentally tested 17 predicted fusions in two pediatric glioma samples and validated 15 of these (88%) with precise resolution of the breakpoints via qPCR experiments and Sanger sequencing, with nearly perfect copy count concordance. Additionally, to further help display and understand the structure of CGRs, we have implemented CouGaR-viz, a generic stand-alone tool for visualization of the copy count of regions, breakpoints, and relevant genes.
Isolated structural variants such as transversions, translocations, duplications, deletions, and insertions have long been hypothesized to play prominent roles in cancer (Albertson 2006; Berger et al. 2011; Stephens et al. 2011). More recently, certain types of large-scale complex genomic rearrangements (CGRs), such as chromothripsis, breakage-fusion-bridges, and double minutes, have been discovered within tumor genomes and implicated in tumorigenesis (Zhang et al. 2013). CGRs involve three or more distant regions of the genome abnormally joining together and have been implicated in 5%–9% of all cancers (Malhotra et al. 2013; Zack et al. 2013) and ∼25% of bone tumors (Stephens et al. 2011). These rearrangements can form distinct highly amplified contigs that harbor oncogenes, resulting in 10- to 100-fold increases in oncogene copy count, which may potentially drive tumorigenesis (Korbel and Campbell 2013). In chromothripsis, a type of CGR, tens to hundreds of rearrangements are localized to a few chromosomes in what is believed to be a single catastrophic event (Stephens et al. 2011; Korbel and Campbell 2013). The ability to accurately detect interacting genomic rearrangements and their overall configuration is a critical step in determining the underlying mechanism and effects of CGRs. The role of isolated structural variants in tumorigenesis is well studied (Forment et al. 2012), but complete characterization of large-scale CGRs still present challenges that existing methods do not solve. In order to understand chromothripsis at a mechanistic level, Zhang et al. (2013) recently demonstrated, using a combination of live cell imaging and single-cell genome sequencing, that micronucleus formation can indeed generate a spectrum of genomic rearrangements, some of which recapitulate all known features of chromothripsis. Recent reports have shown evidence for an independent cellular “path” to chromothripsis via telomere shortening and processing of the resulting dicentric chromosomes (Maciejowski et al. 2015; Mardin et al. 2015).
Most existing methods for structural variant detection attempt to identify each event independent of coverage, making them poorly suited for discovery of CGRs. These methods, including BreakDancer (Chen et al. 2009), PRISM (Jiang et al. 2012), DELLY (Rausch et al. 2012a), CREST (Wang et al. 2011), and nFuse (McPherson et al. 2012), use discordant insert sizes in paired-end whole-genome sequencing (WGS) and precise mapping of split reads to infer the breakpoints of novel structural variants. However, because they predict structural variants without utilizing coverage information, the overall genomic structure is inconsistent and the individual variants can be wrong. For example, consider the case where an amplification has been followed by a deletion within the amplified region. Without considering coverage, the deletion will be reported independently, due to the presence of split reads (or abnormal read-pairs), while the amplification may be overlooked. Tools that do not utilize copy count information as a part of the prediction will fail in such regions. Other tools, like PREGO (Oesper et al. 2012), use coverage information to predict copy number variants but do not report a parsimonious set of contigs explaining new CGRs.
Greenman et al. developed a method that combines allelic copy counts from a SNP array with discordant pairs from WGS into an allelic graph (Greenman et al. 2012). By matching allelic copy counts across breakpoints and solving an integer program to minimize the total number of predicted rearrangements, they were able to detect parsimonious CGR structures. However, SNP resolution and phasing ability limit the resolution of this method, and it is unclear how this method performs when breakpoint information is missing (common near centromeres and in low-mappability regions). Sanborn et al. extended the allelic graph developed by Greenman and colleagues to predict double minutes (circular contigs) generated by CGRs (Sanborn et al. 2013). However, this method is unable to detect amplified linear contigs (as found in breakage-fusion-bridge) or circular contigs with breakpoints in low-mappability or low-coverage regions. Further, in both these methods, evaluating the overall effect of the CGR presents an additional challenge, especially in cases with dozens of rearrangements. To address these issues, we present a novel algorithm named CouGaR (http://compbio.cs.toronto.edu/cougar/) to predict the overall genomic configuration resulting from CGRs and provide CouGar-viz for visualizing the effect on the genome. Our approach considers both depth of coverage (DOC) and discordant reads in WGS data to determine the maximum likelihood copy count of each segment and then finds a parsimonious set of contigs that explain the copy counts.
Results
In this section, we give an overview of the CouGaR algorithm, with full details available in the Methods section. We assess the accuracy of our algorithm on two pediatric glioma patient samples sequenced at the Hospital for Sick Children and provide experimental validation of our results. We then provide a comparison of our method against two published methods by Sanborn et al. (2013) and Oesper et al. (2012) on the same data sets. We also demonstrate the performance of the algorithm on a set of 467 tumor and normal samples from The Cancer Genome Atlas (TCGA). Additionally, we describe our results in identifying chromoplexy events in the tumor samples. Finally we describe CouGarR-viz, a stand-alone tool we have developed to visualize genomic rearrangements.
Overview of the CouGaR algorithm
The aim of our method is to identify complex genomic rearrangements, predict their structure, and determine the copy count in a tumor genome from WGS data. Here, we present a brief overview of the approach (outlined in Fig. 1) and provide additional details in the Methods section.
Overview of CouGaR algorithm. Tumor and normal samples are processed through a five-step algorithm. (A) We identify regions that are potentially amplified (dark blue) across two different chromosomes (red and yellow lines) in the tumor samples (left two contigs) compared to normal samples (right two contigs). We compute depth of coverage (DOC) information and cluster discordant read pairs to represent novel (with respect to hg19) adjacencies in the genome. (B) We identify continuous regions of amplification in the tumor genome using an HMM and DOC information from both tumor and normal samples. (C) We add a single super-source/-sink node, and using a min-cost circulation algorithm, we solve for the copy count of each region in the tumor genome. (D) Finally, a minimal set of circular and linear contigs that explain the coverage is found by formulating an integer programming problem that puts a penalty term on the number of unique contigs used.
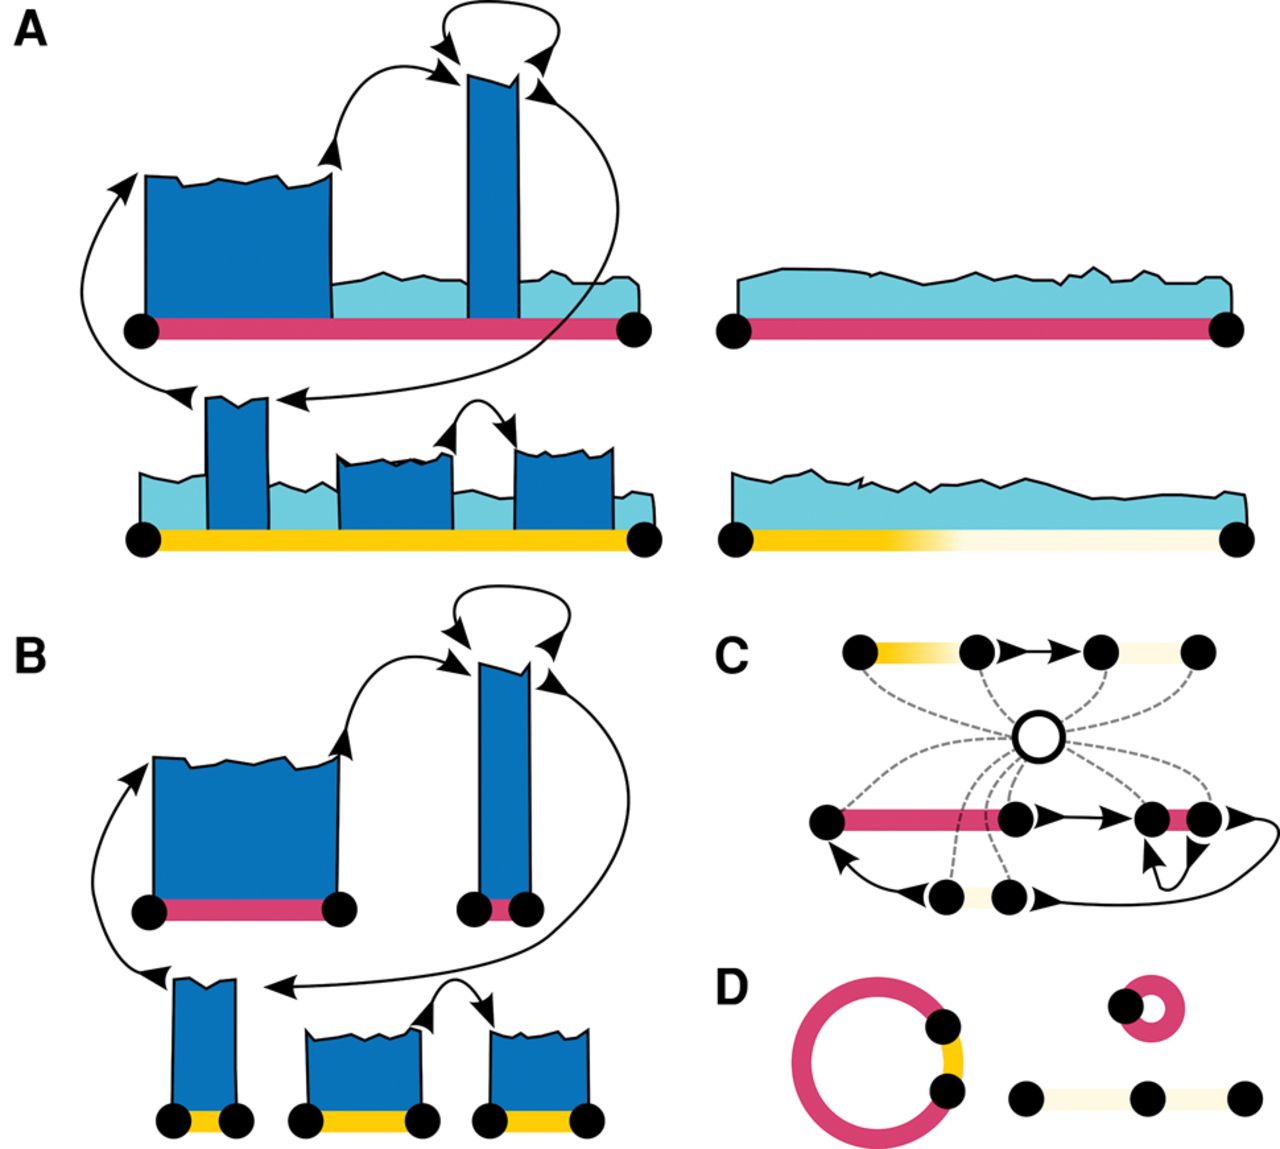
Step 1: Generate a list of tumor adjacencies
We consider both tumor and matched normal genomes concurrently and then generate a list of novel tumor adjacencies, representing genomic regions that are adjacent in the tumor genome but not in the reference genome. Each adjacency in the tumor genome connects two breakpoints in the reference genome, which are the boundaries of two regions adjacent in the tumor. Read pairs spanning these adjacent regions in the tumor will map discordantly to the reference genome, with insert size and/or orientation that differ from the expected. We cluster these discordant pairs and filter clusters with insufficient support (see Methods). Furthermore, we remove clusters present in both the tumor and normal data sets, resulting in a set of clusters describing tumor-specific adjacencies. A distinct type of a genomic rearrangement produces a fingerprint in the form of a unique set of adjacencies (Chen et al. 2009; Medvedev et al. 2009); this represents the list of possible genomic rearrangements present in the tumor genome.
Step 2: Identify amplified regions
To identify genomic regions that are amplified specifically in the tumor sample, we use a Hidden Markov Model (HMM), with states corresponding to tumor copy counts, across the reference genome (Fig. 1A). We interpret the observed read coverage in these regions in the tumor sample as emissions following a Poisson distribution. The transition probabilities are influenced by the tumor breakpoints (from step 1) such that state transitions are more likely at these breakpoint locations. Using the Viterbi algorithm (Durbin et al. 1998), we then determine the most probable copy count for each region. Regions with predicted copy count of less than three are removed from further analysis, resulting in a largely reduced set of amplified genomic regions.
Step 3: Construct a tumor adjacency graph
In our third step, we create a tumor adjacency graph from the adjacencies and amplified genomic regions reported by our HMM (Fig. 1B). In this graph, amplified genomic regions are represented as an edge (labeled with its corresponding DNA sequence), and these edges are then split to create vertices at tumor breakpoint locations. We then join the corresponding breakpoints for each tumor adjacency, representing the adjacency of these two regions in our graph. To properly model the double-stranded nature of DNA (such as inversions), we use the bidirected graph model previously described by Medvedev et al. (2010).
Step 4: Count the number of copies
A network circulation problem is then formulated from the tumor adjacency graph with a min-cost circulation solution coinciding with the maximum likelihood copy count for each amplified genomic region (Fig. 1C). This extends the capabilities of the HMM as it allows for relating copy counts of distant segments in the reference that are adjacent in the tumor genome. A super source/sink node is used to allow linear contigs and model breakpoints missed in step 1. In this network, a unit of flow corresponds to an additional copy of a genomic region. Edges use a convex flow cost function (Medvedev et al. 2010) that equals the negative log emission probabilities from our HMM.
Step 5: Predict contigs
Finally, to predict the set of contigs amplified in the tumor, we extract candidate contigs from the min-cost circulation solution and find a minimal set needed to explain the tumor-specific amplifications (Fig. 1D). Candidate contigs are found by decomposing the min-cost circulation into simple cycles by using depth-first-search (DFS). A cycle that passes through the super source/sink represents a linear contig, while one that does not represents a circular contig. We formulate and solve an integer-programming (IP) problem to determine the least number of contigs required to explain the observed data.
Experimental validation of CGRs in pediatric gliomas
Diffuse intrinsic pontine glioma (DIPG) is a rare and fatal form of pediatric high-grade gliomas arising in the brainstem. Most pediatric gliomas exhibit complex genomic signatures with alterations in copy number, single nucleotide variants (SNVs), and structural rearrangements (Jones and Baker 2014). Specifically, structural variants associated with chromothripsis are common in pediatric high-grade gliomas (Buczkowicz et al. 2014; Fontebasso et al. 2014; Taylor et al. 2014; Wu et al. 2014). Whole-genome sequencing of tumor/normal patient samples was carried out as described in Buczkowicz et al. (2014). We applied CouGaR to the WGS data from 20 DIPG tumor-normal pairs, identified novel breakpoints in nine of them (Supplemental Table S1), and experimentally validated the results from two of the samples (DIPG29 and DIPG06).
Analysis of DIPG29
The predicted CGRs for DIPG29 convolves all 16 predicted breakpoints into a single complex structure (Fig. 2A; Supplemental Fig. S1), spanning parts of Chromosomes 1 and 2. The structure found by our method forces a unique decomposition into four separate contigs with copy counts 15, 15, 12, and 9. Of the 16 predicted novel breakpoints in DIPG29, we were able to design unique primers to amplify across nine breakpoints. We therefore chose these nine for experimental validation using qPCR and Sanger sequencing, and the results (Fig. 2B; Supplemental Table S2) show that our method not only correctly identified the precise location of 7/9 breakpoints but also estimated the copy counts for each of these breakpoints with high concordance to qPCR results. For example, breakpoints ‘A’ and ‘E’ (Fig. 2B) were predicted to be present at 12 copies, and our qPCR results show them to be at 11 and 10 copies, respectively. Similarly, we predicted breakpoint ‘I’ to be present at 42 copies, and the qPCR results were concordant with this (average predicted count of 41.7). To validate whether the copy count estimation is improved by the full approach versus just using the initial HMM, we computed the Pearson correlation coefficient between mean copy count values obtained by qPCR from DIPG29 with the predictions from the full model, and also just from the HMM. The overall model performed noticeably better: r = 0.925 for the full model versus r = 0.805 for the HMM. In each of these cases, we were also able to validate precise breakpoints predicted by our method using Sanger sequencing.
Analysis of DIPG29. (A) The predicted CGRs are convolved into a unique structure as visualized by CouGaR-Viz (the four contigs identified are illustrated in Supplemental Fig. S1). Genomic segments are represented by red lines and are interrupted by black vertical lines to show breakpoints. Directional arrows are used to show connections between the segments, and thickness of the arrows and red segments represent the identified copy counts. Genes overlapping the positive strand are depicted as green boxes and genes overlapping the negative strand are shown in purple. Breakpoints that were selected for testing are shown as letters (A–I) in circles. Here, green circles indicate breakpoints that were validated, and yellow circles indicate breakpoints that failed to validate. (B) Nine breakpoints were selected for validation, and for each of these, unique primers were designed and copy counts were estimated with qPCR. GPX7 gene was used as a control to normalize the counts. For seven of the positively tested breakpoints, the copy counts estimated by qPCR are shown in purple (error bars show standard deviation), and copy counts estimated by CouGaR are shown as orange bars. In all cases, the qPCR results match the predicted copy counts.
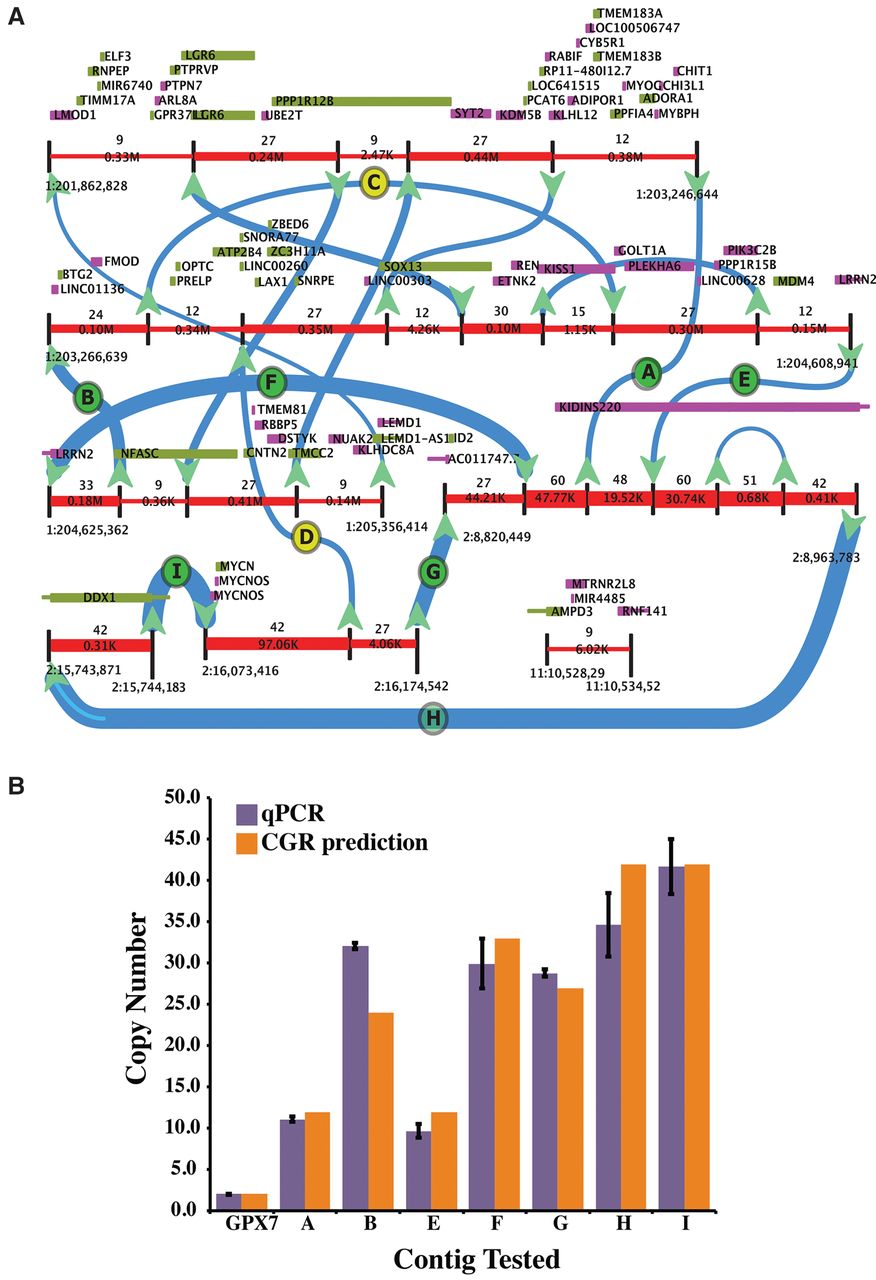
Copy number alterations are known to impact gene expression and are considered to be a hallmark of tumor progression. The presence of known oncogenes and other tumor activating genes in altered regions make a compelling argument for diagnosis and potential therapeutics of certain tumors. In order to understand the biological significance of CGRs in DIPGs, we inspected the genes overlapping the genomic locations of the CGR. The CGR identified in DIPG29 harbors 77 genes, four of which are known oncogenes, namely MYCN, MYCNOS (MYCN-opposite strand), ELF3, and MDM4. MYCN, a transcription factor and member of the MYC family of proto-oncogenes, is known to be amplified in neuroblastoma (Brodeur et al. 1984; Cheng et al. 1993; Meyer and Penn 2008; Dang 2012). MYCN amplification at >10 copies confers growth advantages to the cell and may eventually trigger neoplastic transformation (Seeger et al. 1985). ELF3 is an ETS domain transcription factor that plays an important role in transcriptional regulation during differentiation (Brembeck et al. 2000). MDM4 is a suppressor of TP53 and plays a prominent role in cell cycle arrest and apoptosis (Chen et al. 2005; Jin et al. 2006).
Buczkowicz et al. (2014) recently showed that DIPGs could be categorized into three distinct molecular subgroups: K27M, silent, and MYCN. DIPG29 belongs to the MYCN group, which is also characterized by a hypermethylated genome and the presence of amplifications of MYCN and ID2. Both MYCN and ID2 are located in the CGR identified with DIPG29, further demonstrating the ability of CouGaR to uncover biologically relevant CGRs. Similarly, in another sample, DIPG06 (Supplemental Fig. S2; Supplemental Table S3), we were able to validate all eight of the breakpoints tested. Taken together, using a combination of Sanger sequencing to confirm the breakpoints and qPCR for estimating the relative copy number of the rearrangement, we were successful in validating nearly 88% (15/17) of the selected breakpoints from the two DIPGs tested. One of the two breakpoints that did not validate was identified to be near a long repetitive region. Crucially, we were very successful in quantifying the copy counts associated with each of these breakpoints. Furthermore, our analysis of the genes overlapping these regions shows our ability to identify biological consequences of CGRs in DIPGs.
Comparison of CouGaR to prior methods
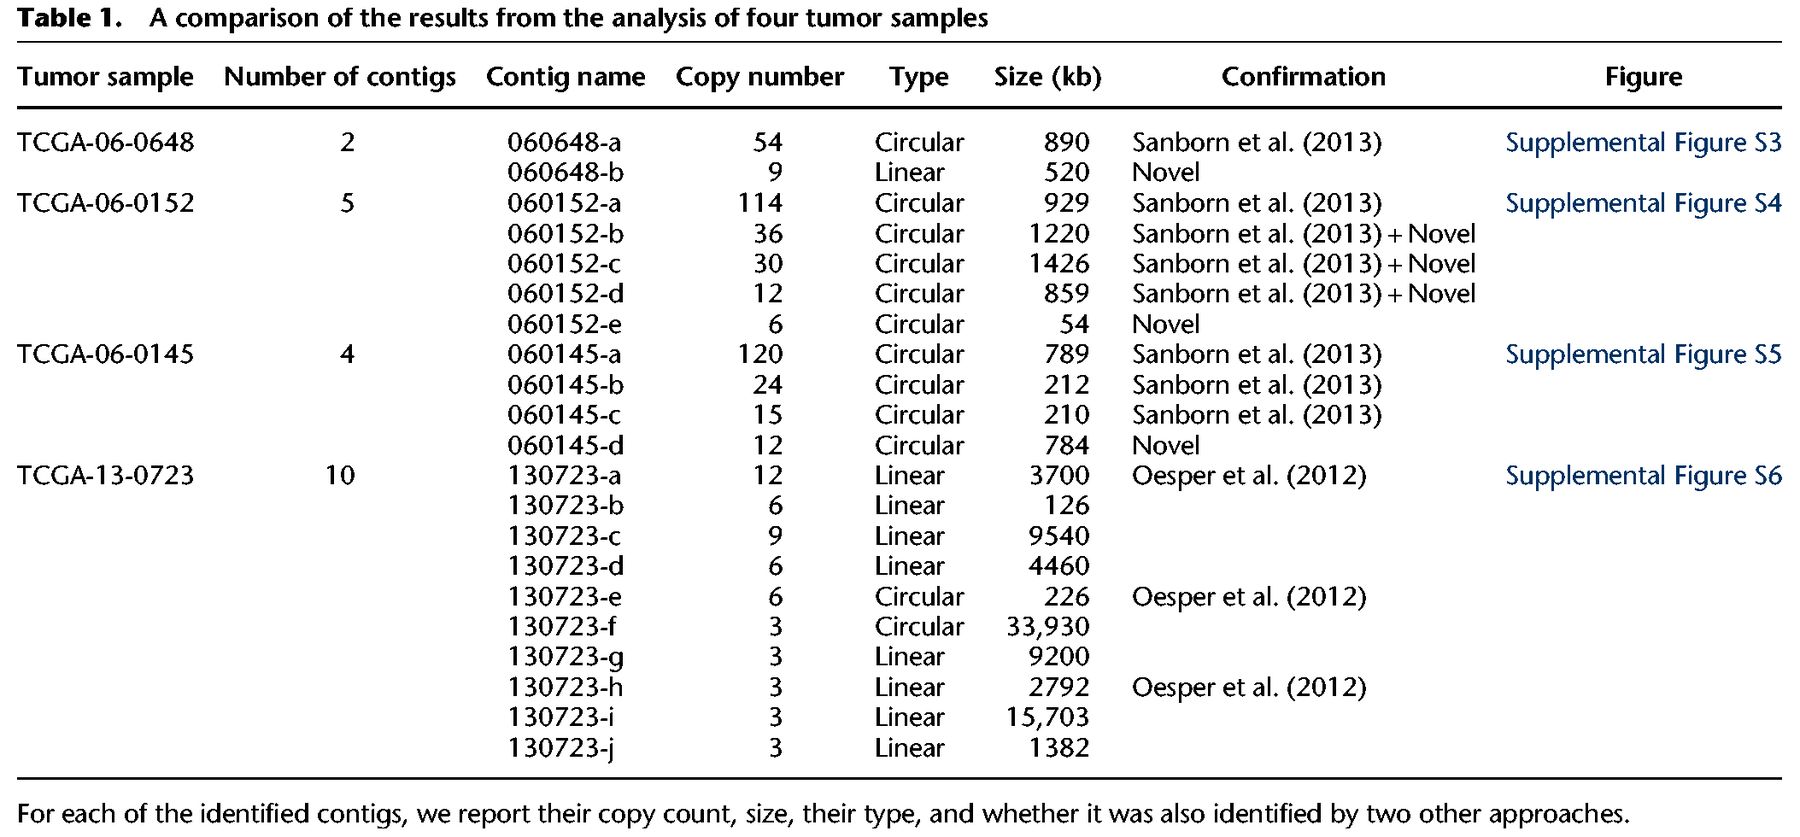
In order to further evaluate the accuracy of CouGaR, we compared our results on four TCGA samples that were also analyzed by other methods. Three of the samples are from glioblastoma multiforme (GBM) and contain highly amplified circular contigs representing double minutes, which were reported by Sanborn et al. (2013), while in the fourth case, we describe results from an ovarian cancer sample with multiple amplified fold-back inversions (Oesper et al. 2012). In all four cases, our method successfully identified all but one of the previously identified CGRs, which was a very short region of 230 bp. Importantly, our method also identified amplifications that were not previously observed (Table 1). Visualization of the predicted results for each of the tumor samples (Supplemental Figs. S3–S6) and detailed description of each contig and overlap with previous results is available in Supplemental Information.
A comparison of the results from the analysis of four tumor samples
We also compared CouGaR with two published methods, BAMBAM (Sanborn et al. 2013) and nFuse (Malhotra et al. 2013), on DIPG29. On this sample, CouGaR reported 16 breakpoints, while BAMBAM reported 157 and nFuse reported 25 breakpoints. Of the 16 reported by CouGaR, six were also reported by all three methods, whereas the other 10 were found by BAMBAM as well (Supplemental Fig. S7 for a Venn diagram). The total number of breakpoints found by nFuse was similar to CouGaR; however, only 6/25 were common predictions. BAMBAM reports a lot more breakpoints than the other two methods, of which only a small fraction (16/157) is consistent with CouGaR predictions. CouGaR showed higher concordance with both BAMBAM and nFuse than the two with each other. BAMBAM and nFuse shared only 9/157 BAMBAM predictions and 9/25 nFuse predictions.
We then compared the junctions identified by each of the methods against the nine breakpoints that were picked for PCR validation (Supplemental Table S4). All of the seven validated breakpoints were also reported by BAMBAM, whereas nFuse reported only five validated breakpoints. Finally, we compared the estimated copy counts of CouGaR and the estimated copy counts by BAMBAM (this is generated for genes and not for breakpoints and thus could not be compared with the qPCR results). For the genes MYCN, PLEKHA6, MDM4, and ELF3, BAMBAM reports a copy count of 49.9, 29.6, 12.9, and 10.6, respectively, whereas CouGaR reports a copy count of 42, 27, 12, and 9, respectively. nFuse does not estimate copy count and therefore could not be compared. Overall, this shows that CouGaR generates reliable predictions of genomic rearrangements.
Identification and characterization of CGRs from TCGA samples
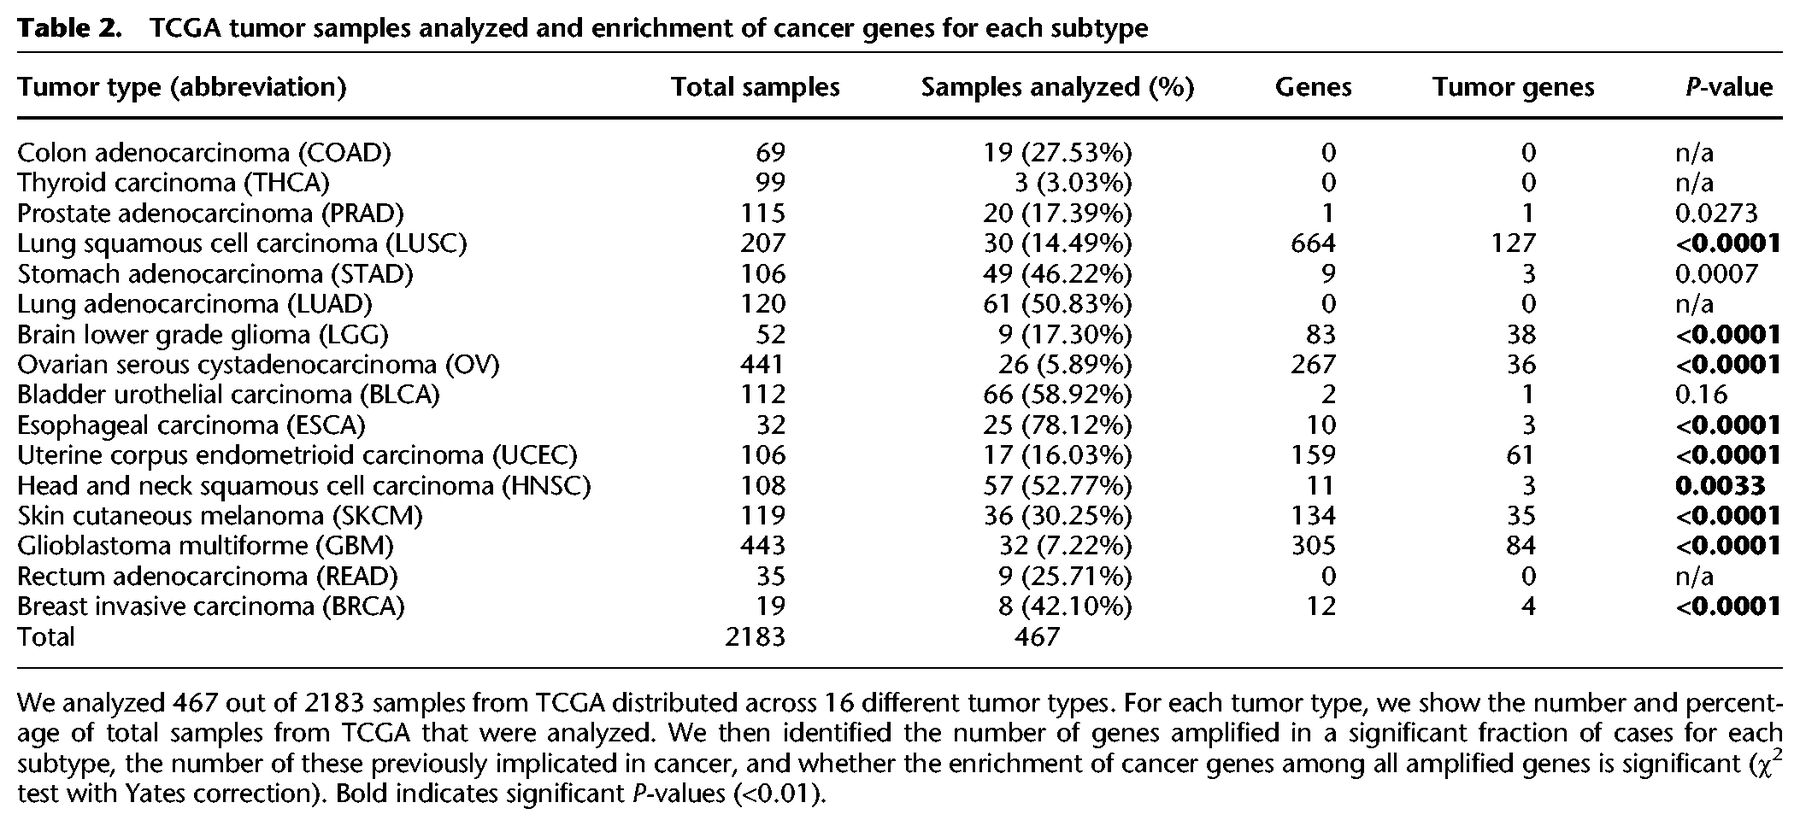
Two thousand one hundred eighty-three WGS samples from TCGA were obtained and filtered to enrich for those most likely to contain CGRs based on SNP array profiles (as described in Methods) to generate a set of 467 samples (Table 2). We applied CouGaR to these 467 samples and carried out quantitative analysis of circular and linear contigs present in them (Supplemental Table S5). CouGaR identified at least one contig (≥3 copies) in 443 of the 467 samples analyzed, and on average we found 6.25 contigs per sample. Interestingly, the 6.25 contigs per sample is nearly twice as many as previously reported (Malhotra et al. 2013). The lower number reported earlier could be attributed to both lack of methods that were capable of identifying these CGRs accurately and to the smaller number of samples analyzed.
TCGA tumor samples analyzed and enrichment of cancer genes for each subtype
Since sequencing coverage plays a crucial role in our ability to reasonably estimate CGRs, we checked for coverage bias associated with CouGaR by splitting the samples into those with high (>30×) or low (<30×) coverage. In most cases, there is comparable coverage in tumor and normal samples (Supplemental Fig. S8), and we see that the ratio of coverage in the tumor and normal samples is nearly equal (for most samples it is within a factor of 1.5 of one another). While most samples have equivalent coverage in the tumor and normal sample, 23 (∼5%) have more than two times the coverage in either the tumor or normal sample. On average, we find 7.1 contigs in the high-coverage samples and 5.9 contigs in the low-coverage samples, both similar to the overall average of 6.25 contigs per sample.
We find that 204 of the 467 samples (∼43.5%) contain amplified circular contigs (≥6 copies), 80 have >10 copies, and 32 are highly amplified (≥30 copies). These circular contigs range in length from 1 to 91.5 Mb, with an average length of 3.61 Mb, which is consistent with previously published data (Oesper et al. 2012; Rausch et al. 2012b; Sanborn et al. 2013; L'Abbate et al. 2014). Also, among the 467 samples, 326 (∼70%) have amplified linear contigs (≥6 copies); 49 of these have ≥10 copies and four are highly amplified (≥30 copies). These linear contigs are present at an average length of 1.37 Mb. Overall, 388 (83%) of our 467 samples (and at least 17.8% of the original data set of 2183 samples) have either a circular or linear amplified contig (≥6 copies) present in them, with 113 (24% of selected set and 5.2% overall) having >10 copies and 36 (∼8% of selected set and 1.65% overall) of them being highly amplified (≥30 copies). The distribution of length of the identified contigs is consistent across the different tumor types, and furthermore, high- and low-coverage samples show a similar distribution of contig lengths (Supplemental Fig. S9).
It has been previously reported that CGRs are found in 5%–9% of all cancers (Malhotra et al. 2013; Zack et al. 2013) and ∼25% of bone tumors (Stephens et al. 2011). However, these estimates depend on three factors: first, the type of data utilized (array or sequencing); second, the computational method implemented; and third, the specific types of cancer samples analyzed. Previous analysis of CGR events (Kloosterman et al. 2011; Stephens et al. 2011; Brastianos et al. 2013; Malhotra et al. 2013; Mehine et al. 2013) did not use the same algorithm nor did they carry out their analysis across a wide range of tumor types to give robust results. In the current work, we use whole-genome sequence data (considered to be the most sensitive in identifying CGRs), carry out our analysis across >450 samples, chosen from 2183, and as demonstrated above, use an algorithm that is very accurate in identifying CGR events. We find that >20% (443/2183) of all samples contain at least one contig as reported by our method. The results at the tumor level are more variable (Supplemental Fig. S10); depending on the type of tumor analyzed, we see anywhere from 1% to ∼80% of the samples carrying at least one CGR. Since we analyze hundreds of samples in many of the tumor types, we provide more robust results of CGR presence in the tumors.
High incidence of chromoplexy in prostate and bladder cancers
Chromoplexy, a phenomenon where complex genomic rearrangements typically involving up to 10 chromosomes is not uncommon, is known to occur extensively in prostate cancers (Baca et al. 2013; Zhang et al. 2013). We therefore looked at the distribution of contigs that span single, double, or multiple chromosomes for each of the tumor types (Fig. 3). In the case of prostate cancers, we see that nearly 63% of the samples analyzed have contigs that span three or more chromosomes, very similar to reported numbers (Baca et al. 2013). It is of note that we see ∼27% of bladder cancer samples analyzed to have contigs spanning multiple chromosomes. This is interesting because, while it has been found that bladder cancers and prostate cancers can be coincidental (Chun 1997), high rates of chromoplexy have not been reported in bladder cancer previously. Furthermore, while many other tumor types (STAD, UCEC, SKCM) have 10%–15% of samples with multichromosomal contigs, it is interesting to note that both colon (COAD) and rectal (READ) cancers (which are molecularly homogenous and are often combined for analysis) have nearly no contigs spanning more than one chromosome (except one colon cancer sample).
Distribution of multichromosome contigs. For each of the tumor types, we looked at the chromosomes that each of the contigs span and binned each sample based on the most chromosomes spanned by any contig. In the bar chart, we show the percentage of samples based on the contig with the largest number of chromosomes (1–9). For each cancer type, we also report as a fraction the number of samples with a contig spanning three or more chromosomes. We notice that prostate (PRAD) and bladder (BLCA) cancers have a high occurrence of multichromosome contigs. On the other end of the spectrum are colon (COAD) and rectal (READ) cancers, with most contigs contained in one chromosome.
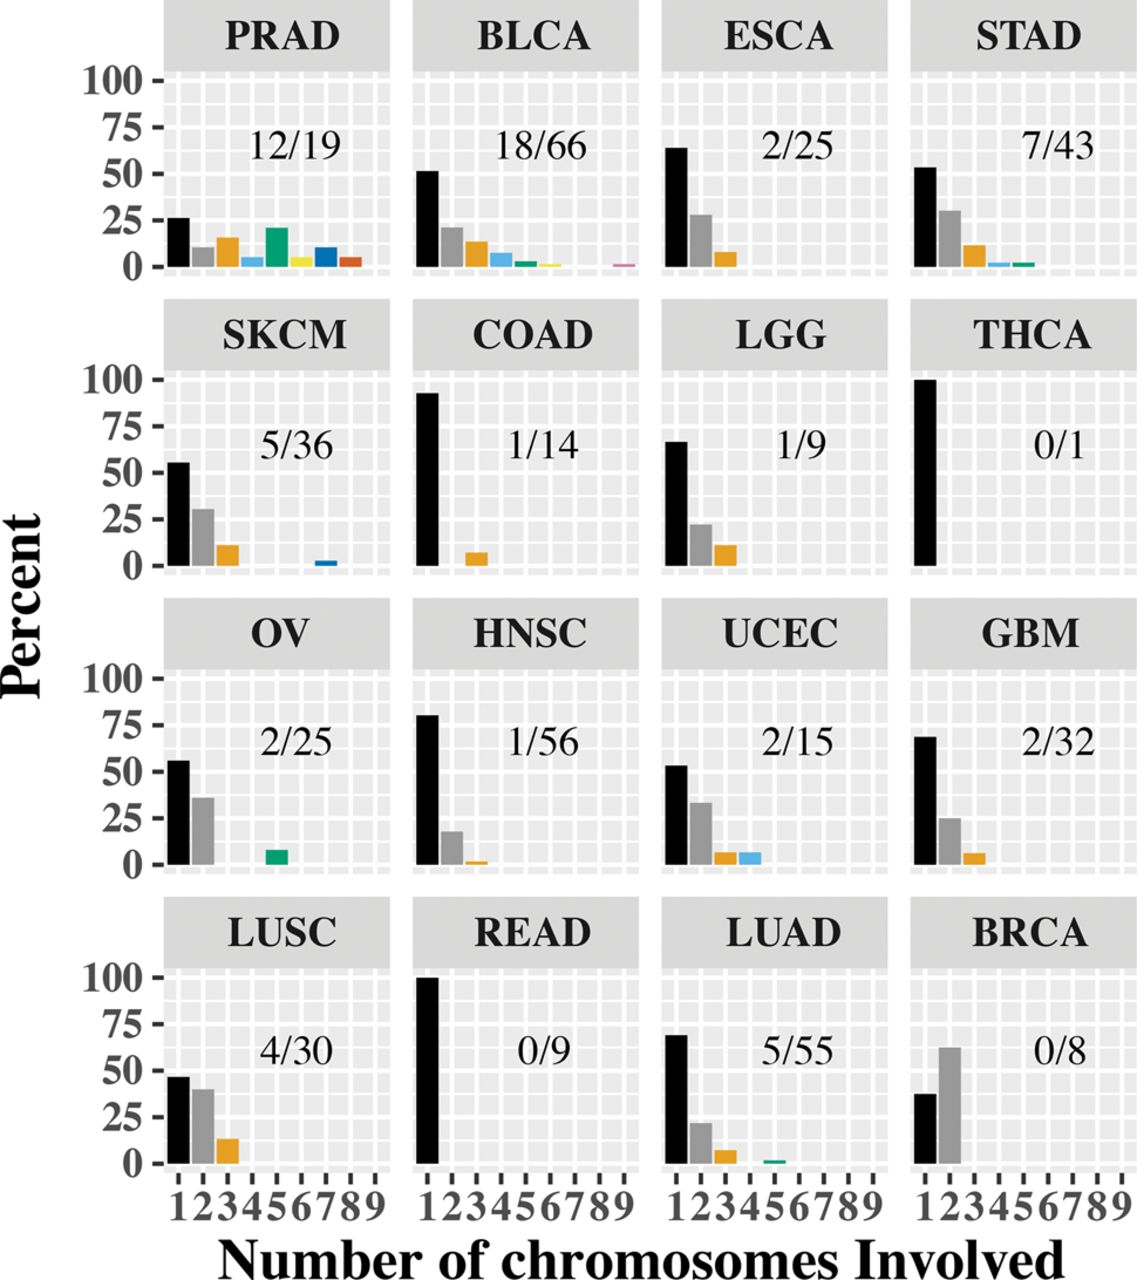
Chromoplexy is known to be associated with oncogenic gene fusions in prostate cancer. Specifically, it was reported that the fusion involving the TMPRSS2 gene with ERG frequently arose (∼50% of the cases) in the setting of chromoplexy (Baca et al. 2013). Furthermore in tumors that did not carry this fusion, the involvement of the gene CHD1 along with several other oncogenes (PTEN, TP53, CDKN1B) was observed (Baca et al. 2013). To ascertain the presence of the TMPRSS2-ERG fusion and the involvement of oncogenes, we processed each of our tumor samples using the structural variant caller DELLY2 (Rausch et al. 2012a). We identified the occurrence of the TMPRSS2-ERG fusions in seven of the 19 samples (∼37%), lower than previously reported by Baca et al. This is potentially due to lower read depth in TCGA samples, where the read depth associated with the PRAD samples was around 10× (in both tumors and normal), and this low coverage may have resulted in us identifying the fusion in a lower proportion of cases. We were unable to determine the presence of any structural variation in CHD1 or other oncogenes associated with PRAD.
Analysis of genes involved in CGRs
An important indicator of the potential oncogenicity of these CGRs is the function of genes located within them. To assess the frequency of oncogenes present in CGRs, we scanned the amplified regions for overlapping genes and identified known oncogenes. Ninety-five percent (108 of 113) of the tumors with a contig present at 10 copies or more contain at least one gene implicated in tumor progression (Supplemental Table S6), compared to a 58% baseline based on simulations of randomly picked CGRs of the same length across the genome (100,000 iterations). The standard deviation was 12%, corresponding to a z-score of 3.1 and a P-value of 0.0009. Of the 36 samples that have highly amplified (≥30 copies) regions, 100% contain a full-length oncogene. Most of these are well-known tumor-associated genes. For example, TCGA-06-0211 contains multiple interruptions within the amplified EGFR gene, which leads to fusions (EGFR-LANCL2, EGFR-SETP14) that have been verified by RNA-seq (Shah et al. 2013). MDM2 (MDM2 proto-oncogene), amplified in TCGA-26-1438, is a negative regulator of the TP53 tumor suppressor, and therefore, amplified expression of MDM2 represses the transcriptional activity of TP53 and this results in uncontrolled cell proliferation (Chen et al. 2005; Carrillo et al. 2014). Furthermore, MDM2, independent of TP53, is known to promote genome instability due to its role in double-strand break repair (Carrillo et al. 2014). Similarly, MYC, found in TCGA-EE-A2M6, is a transcription factor and nuclear phosphoprotein that is known to play pivotal roles in malignant transformation (Meyer and Penn 2008; Dang 2012). The identification of these tumor-associated genes in 95% of the highly amplified regions is further support for the accuracy of our method and the importance of CGRs for oncogenesis.
Finally, for each tumor type, we checked if the number of tumor genes within amplified contigs was enriched in a statistically significant manner. In Table 2, for each of the 16 tumor types, we report the total number of significant genes, the total number of significant tumor-associated genes along with their P-value (χ2 with Yates correction; see Methods). Of the 16 tumor types in TCGA, 12 had at least one amplified gene; of these, 11 were statistically enriched for tumor genes. A complete list of significantly identified genes (Supplemental Table S7) and gene interruptions (Supplemental Table S8) that were present in each cancer type along with their frequency of occurrence and P-value can be found in Supplemental Information.
Visualization of CGRs
In order to facilitate visualization of complex genomic rearrangements generated via CouGaR or other means, we have developed a package called CouGar-viz, a stand-alone tool implement in ‘racket.’ Both packages (CouGaR and CouGaR-viz) can be obtained from http://compbio.cs.toronto.edu/CouGaR/ and have been included as Supplemental Archives (1 & 2). The tool takes in as input a set of genomic regions and gene annotations (see the Method Manual for format details) and outputs a scalable vector graphic image. The resulting image (see Fig. 2A and Supplemental Figs. S1, S2A for examples) shows a bidirected graph that traces a path joining the contigs identified in the CGR while displaying the genomic coordinates and the copy counts of these locations. It then layers the locations of annotated genes that overlap the contigs to make a final image that makes it easy to visualize the complicated structures that occur in CGRs. This makes for easier interpretation of the often-complex structures that are a result of these rearrangements.
Discussion
In this paper, we present CouGaR, a novel method for the identification of complex genomic rearrangements in cancer genomes. The algorithm robustly combines DOC and pair-end reads mapping to infer the genomic structure resulting from amplified CGRs. While available methods require a complete set of breakpoints involved in a CGR to predict their structure, CouGaR overcomes this limitation by simultaneously considering circular and linear contigs to be used in a parsimonious solution. This is important even if just predicting circular contigs, because if one breakpoint in the cycle becomes obscured (i.e., in centromeric regions), it breaks the cycle and makes them difficult to identify. If breakpoints happen to be obscured, our method will report the linear components of the broken cycle.
Another advantage of our method is that it does not assume that novel CGRs will have additional copies of telomeres. This overcomes limitations of previous approaches and enables prediction of structures with obscured connectivity to telomeres or those without telomeres, such as double minutes. Our method performs exceptionally well in experimental validations with 15/17 (88%) tested fusions being confirmed by qPCR with nearly exact prediction of the number of copies of each CGR event that was experimentally tested. In our analysis of TCGA data, we demonstrate that 9/15 tumors with any amplified genes are enriched for oncogenes and tumor-activating genes, further validating the accuracy of our method. Additionally, we have developed CouGaR-viz, a tool that can illustrate the results of the method in an easily interpretable format. This is extremely useful when trying to understand the complexity of some CGRs.
Currently, the method does not explicitly consider intra-tumor heterogeneity, which can affect the results. For instance, tumor purity will certainly affect read depth and copy number estimates, especially when it comes to highly amplified regions, and the existence of tumor subpopulations could also confound the results. In the current release of the algorithm, we have a step in the normalization of tumor coverage that takes a parameter to normalize for purity. It is set to ‘1,’ i.e., pure tumor and normal samples, and is meant to control for normal contamination in the tumor. We hope to address this in future releases so that user-specific values for tumor/normal contamination can be provided.
Our method also has a few limitations. First, the current method may have difficulty in regions of the genome that are copy-variable, because in normal samples we assume a genome-wide copy count of two. If the underlying normal genome violates this assumption, then our copy count estimates in the tumor genome will be proportionately off. Secondly, we do not use the allelic ratios in WGS data to stabilize copy count estimates across tumor adjacencies (Greenman et al. 2012). Furthermore, we do not resolve ambiguities presented by the overlap of circular contigs. When a circular contig overlaps another contig, it is not clear from WGS data if both are independently present in the cell or a super-contig containing the two is present. This may be difficult to resolve from WGS data because there is no difference in reads sequenced from two contigs independently or one joined contig.
Methods
Computational identification of CGRs
We use an HMM to localize tumor-specific amplification events and use a min-cost circulation to further refine copy count estimates. To explain the amplified regions, we enumerate candidate contigs by decomposing this min-cost circulation, and finally, we find a minimal set of contigs best explaining the observed data.
Identifying tumor adjacencies
We identify tumor adjacencies by greedily clustering discordantly mapped read pairs. First, we iterate over the sorted list of reads, considering a discordant read pair mapping to be one where both reads map to the same strand or have an insert size greater than μ + 6σ (where μ and σ are the observed insert size mean and standard deviation, respectively). Then, we consider the innermost coordinates of its mapping—the positions closest to the implied breakpoint. If both coordinates reside within 12σ of an existing cluster and have equal strand orientation, the read pair is added to that cluster; otherwise, a new cluster is created. We use such a wide cluster definition because missing adjacencies break circular contigs within the graph; however, a few additional false positive adjacencies are left unused by the maximum likelihood formulation below. The strand orientation of a cluster determines the type of adjacency this cluster represents.
For every orientation of two regions in the tumor genome, a read pair spanning their boundary will map with a unique signature to the reference genome. Therefore, there are four types of adjacencies possible, that represent the four possible strand configurations of the adjoining regions in the tumor genome: (+,+), (−,+), (+,−), (−,−).
Next, we identify tumor-specific clusters by filtering out those that are located within 3 kb of a cluster found in the normal sample with similar coverage. We also filter out those with less than five supporting read pairs or with a large standard deviation (>200 bp) in the innermost coordinates of reads belonging to either breakpoint. Clusters with large standard deviations in their innermost coordinates of their read mappings tend to be mapping artifacts from low-quality mapping (Supplemental Fig. S11). Finally, we filter out all clusters that represent deletions of length 2 kb or smaller in the reference genome. Filters for mapping quality are not used because this would filter clusters from segmental duplications and regions near the centromere, which is undesired.
G/C coverage normalization
We normalize for GC and coverage differences between normal and tumor by downsampling read arrivals in the respective bin and sample. By downsampling, variance is artificially reduced and the samples become comparable on both a GC and genome wide level. To normalize for GC bias, we bin each properly mapped read pair into one of 301 GC bins based on the GC content of a 300-bp window centered between the mapped reads. The GC content of this 300 bp approximates the GC content of the original DNA fragment. Then, the bins are normalized by downsampling either the tumor or normal bins to match the other.
Localization of events
We use an HMM to localize amplification events and remove all normal copy count regions from further analysis. We run the HMM over a partitioning of the reference genome into regions such that tumor breakpoints reside on the boundaries, and regions between breakpoints are split into units of size less than a maximum edge length Emax. Emax is set such that the expected value of observing a >1.5× DOC for a region with copy count 2 is <10−20. A smaller Emax allows better resolution of breakpoints but only when there is sufficient coverage. States of the HMM correspond to copy counts of a specific region (bounded above by 120). We define emission probabilities by modeling the number of tumor reads mapped to a given region (MAPQ 20) as result of a Poisson process. The λ parameter of this process is set as the expected number of reads mapped for the given copy count. Assuming a copy count of two in the normal sample, λ is set to half of the observed read mappings (in the normal sample) multiplied by copy count. More specifically, for a region e, with read coverage ne in normal and te in tumor sample, we define the likelihood of a copy count fe to be
The transition probability between different copy count states varies depending on whether the region is flanked by a tumor breakpoint. For regions bordered by a breakpoint, the change of state transition probability is 0.4/(120 − 1); otherwise, it is 0.001/(120 − 1). These state transition probabilities are uniform because sudden changes in coverage are expected by amplified tumor contigs traversing tumor adjacencies.
Using Viterbi decoding, we find an assignment of copy counts for each region that minimizes the following negative log-likelihood function with respect to
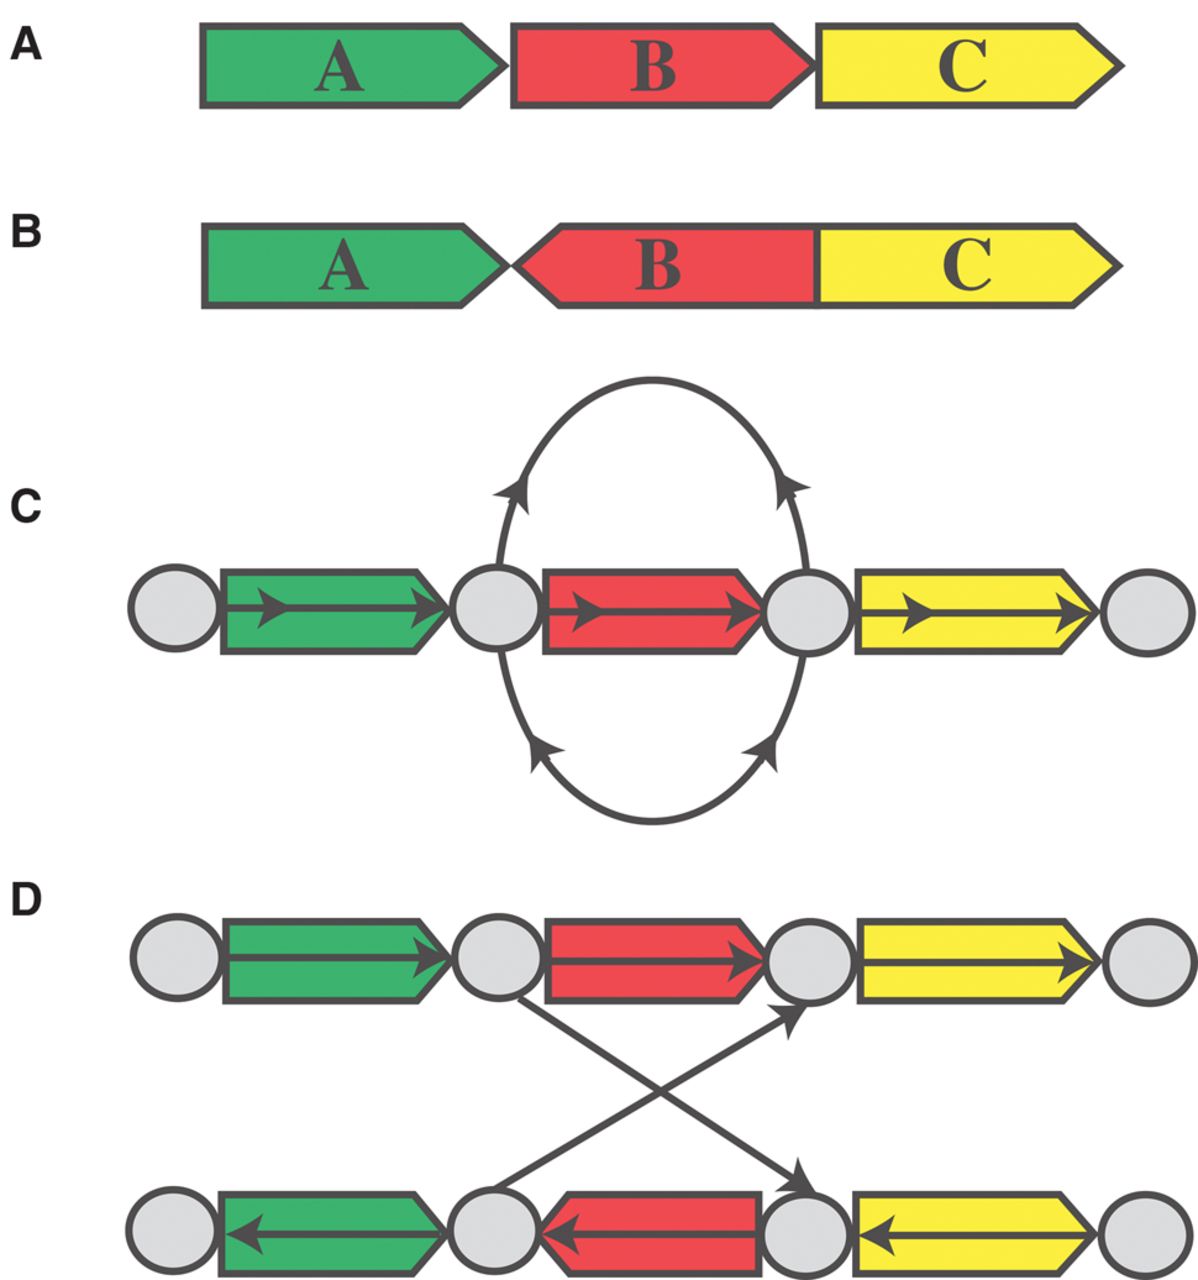
Building a tumor adjacency graph
Construction of the bidirected adjacency graph begins by interpreting all regions with predicted (by our HMM) copy count of three or more as edges. Then, edges are split around tumor breakpoints until every breakpoint resides at a vertex in the graph. Every edge is labeled with its respective DNA sequence from the reference genome. Next, we connect each pair of tumor breakpoints belonging to the same tumor adjacency with an edge type corresponding to the type of adjacency. The bi-directed nature of this graph is necessary to correctly model tumor adjacencies with breakpoints on different strands of DNA. For example, using a bidirected graph, we can properly model two adjacencies provided by the discordant pair clustering of an inversion (Fig. 4). We can also represent the same structure using a directed graph by doubling the number of edges and vertices from the bi-directed graph (Fig. 4D). Assuming all amplified contigs in the tumor genome are rearrangements of regions from the reference genome, then every contig must have a walk in our adjacency graph that spells out its DNA sequence.
Tumor adjacency graph. (A,B) Reference and tumor genome, respectively. (C) The bidirected graph representation of the tumor genome. (D) The directed graph equivalent to C.
Using maximum likelihood for counting copies
The above HMM is limited because it is unable to relate copy counts across tumor adjacencies. This limitation forces uniform transition probabilities in order to accommodate large copy count changes that can only be accounted for by taking into consideration tumor adjacencies.
To overcome these limitations, we augment the tumor adjacency graph to a network circulation problem (Medvedev et al. 2010). For a region e with respective read coverage ne and te in normal and tumor sample, we reinterpret the convex negative log emission probabilities from our HMM as the cost of flow along the corresponding edge e. For tumor adjacency edges, denoted TE, we assign a constant cost SE(e∈TE) per unit of flow that reflects the confidence of the edge based on breakpoint mappability. Next, we add a super-source and a super-sink and connect them with an edge q of cost Q. Solving for min-cost circulation f in the resulting network gives the following:
Thus, the optimal flow assignment to an edge e corresponds to the maximum likelihood copy count of the associated region e.
As the value of Q in Equation 3 approaches zero, the circulation solution converges to the local minimum of each edge cost function, which is equal to the DOC ratio between the tumor and normal allele, te/(ne/2). On the other hand, a very large value of Q forces all flows to avoid the super-source and -sink, resulting in circular flows representing circular contigs within the adjacency graph. In practice, we set Q = 13500, so that we are able to identify a linear contig with copy count 10 based on ∼25,000 fragments per allele:
Tumor adjacency edges are assigned costs based on the mappability Mb of each respective breakpoint from the ENCODE CGR 100-kmer mappability track (Derrien et al. 2012). More specifically, for a tumor adjacency edge e, with average 100-kmer mappability and over 60-bp windows centered at respective breakpoint b1 and b2, the cost per unit of flow is
Changing the meaning of a single unit of flow to represent m copies instead of one trades off between copy count accuracy and the effect of noise, thus requiring noise to be present with a larger copy count to affect the circulation solution. In our experiments, we use m = 3, and the original negative log-likelihood function given by Equation 3 is then correspondingly modified to
Since there is no fast and readily available bidirected flow solver, we monotonize the graph (Fig. 4D) and use a regular directed flow solver to find a half-integral 2-approximation (Hochbaum 2004; Medvedev and Brudno 2009).
Predicting contigs
Finally, we predict amplified contigs in the tumor by finding a minimal set of simple contigs from the min-cost circulation solution by using an integer programming formulation. We decompose the circulation into simple cycles that generate the set of candidate simple contigs. Every walk in the circulation corresponds to exactly one possible tumor contig; unfortunately, the converse is not true, and amplified tumor contigs can correspond to multiple walks in the circulation.
We augment the negative log-likelihood function (Equation 9) minimized by the min-cost circulation to become the IP objective function. A limitation of the min-cost circulation solution is the inability to weigh the number of unique or circular contigs used. Thus, we replace the term penalizing the number of linear contigs fq in the log-likelihood function with the number of unique contigs used L and solve for f that minimizes
IP constraints are set to fix equality between edge and simple contig multiplicities. The multiplicity ci of the i-th contig represents the number of times this contig is used. The number of times a contig ci uses an edge e is fi,e. Because each candidate contig is simple, it can use an edge at most twice (forward and reverse strand). We use the following constraint to fix edge and contig multiplicities:
Solving this IP gives multiplicities for a minimal set of contigs that explain the observed data. We use GUROBI linear solver to find a near optimal solution.
Preprocessing and data filtration
Two thousand eight hundred thirteen WGS samples across 16 tumor types that had both SNP array and WGS data available were downloaded from The Cancer Genome Atlas consortium. These were filtered based on their likelihood to contain amplified CGRs. Since multiple amplifications in SNP array data are a good indicator of samples with CGRs (Zack et al. 2013), we used the SNP data to build a simple discriminator with three parameters: the length of amplification l, the number of amplifications of at least such length n, and the threshold amplification value t. We then apply this discriminator by considering candidate samples to be those with at least n regions with log ratio of amplification greater than t and length at least l. Applying this discriminator with n = 2, t = 1.4, and l = 15 kb identified 482 candidate samples from 16 tumors. Of these 482 samples, we were unable to process 14 samples due to various errors (Supplemental Table S9), and additionally, we removed one more sample (TCGA-50-5055; likely to be a sample mix up—female patient, male tumor). We therefore have 467 samples in total and present our analysis on these (Table 2).
Tumor gene list
We generated a set of tumor-associated genes by combining tumor genes from various databases and published studies. The complete list of genes and the associated databases can be accessed in Supplemental Table S6.
Estimating gene significance
For every tumor type (T) in Table 2, we simulated N(T) genomes, where N(T) is the number of TCGA samples analyzed. We randomly picked regions in the genome to resemble CGRs while keeping the length of the regions and the number of regions in each genome identical to the distribution of the number of contigs and contig lengths identified by CouGaR in the tumor. We then identified the genes that overlap these regions, either fully or partially, and calculated their frequencies. We repeated this process 1 million times for each tumor and combined the results of all iterations to get the background distribution. Then, given a list of amplified genes, we computed the P-value of each gene being amplified with respect to the null model of random gene amplifications simulated above. We repeated this process for each of the tumors and identified the genes that are significantly amplified in the different tumors. To check if the frequency of tumor-associated genes found in any tumor was significant, we carried out a χ2 test with Yates correction.
Experimental validation
Genomic DNA was extracted from snap-frozen post-mortem tissue from two diffuse intrinsic pontine glioma patients (DIPG06 and DIPG29) using the DNeasy Blood & Tissue Kit (Qiagen) according to the manufacturer's protocol. Primers for each predicted breakpoint were designed using Primer3 (Untergasser et al. 2012). The sequences of the primer pairs can be found in Supplemental Tables S10 and S11. In order to validate the presence of predicted structural variants, end-point PCR was performed for each primer pair, and presence of PCR product at the expected size was determined by visualization on a 1% agarose gel. Lanes containing a PCR product were excised, and DNA was extracted using the Qiaex II Gel Extraction Kit (Qiagen). The sequences of predicted breakpoints were validated by bidirectional Sanger sequencing performed at The Centre for Applied Genomics (Toronto, ON, Canada).
Determination of copy number for the validated structural variants by quantitative real-time PCR was conducted on the ABI Step One Plus RT-PCR (Applied Biosystems) system using the SYBR Green PCR Master Mix (Applied Biosystems). GPX7 primers were used as an internal copy number control. Copy number was calculated from C(T) values using the delta delta C(T) method (Livak and Schmittgen 2001).
Visualization with CouGaR-viz
CouGaR-viz is a visualization package for laying out complex genomic rearrangements, specifically focusing on those occurring in amplified regions. It takes as input a genomic regions file that describes the locations the amplifications in the CGR. Each genomic region is made up of two lines, the first describing germline linkages (edges) and the second describing somatic linkages found in the tumor. The software uses a gene annotation file (hg18 and hg19 are provided with the package) to compare the coordinates of rearrangements to the gene annotations.
Genes on the positive strand are displayed in green and genes on the negative strand are colored purple. Genes should be one rectangle, but if they run outside of the genomic interval illustrated, they have a smaller tail coming off to show that the gene continues in an interval not rendered. Tumor adjacencies have two arrows and a line thickness. The line thickness is the log(copy count), and then arrows represent the adjacency type. Genomic intervals are red and have thickness equal to log(copy count). The visualization package is written in racket and is available on GitHub (https://github.com/compbio-UofT/CouGaR-viz) and as Supplemental_Archive_2.
Data access
Sanger sequencing traces from this study have been submitted to the NCBI Trace Archive (https://trace.ncbi.nlm.nih.gov/Traces/sra/sra.cgi) under TI numbers 2344111621–2344111650.
Acknowledgments
The authors thank members of Centre for Computational Medicine at SickKids for useful discussions and criticisms. The results published here are in part based upon data generated by the TCGA Research Network: http://cancergenome.nih.gov/. This work was partially supported by Genome Canada and Ontario Genomics/Genome Quebec through the Genome Innovation Network node C3G, by the Canadian Cancer Society Research Institute (702296), and by the Canadian Institutes of Health Research.
Notes
[1] Supplementary material [Supplemental material is available for this article.]
[2] Article published online before print. Article, supplemental material, and publication date are at http://www.genome.org/cgi/doi/10.1101/gr.211201.116.
References
- ↵Albertson DG. 2006. Gene amplification in cancer. Trends Genet 22: 447–455.
- ↵Baca SC, Prandi D, Lawrence MS, Mosquera JM, Romanel A, Drier Y, Park K, Kitabayashi N, MacDonald TY, Ghandi M, 2013. Punctuated evolution of prostate cancer genomes. Cell 153: 666–677.
- ↵Berger MF, Lawrence MS, Demichelis F, Drier Y, Cibulskis K, Sivachenko AY, Sboner A, Esgueva R, Pflueger D, Sougnez C, 2011. The genomic complexity of primary human prostate cancer. Nature 470: 214–220.
- ↵Brastianos PK, Horowitz PM, Santagata S, Jones RT, McKenna A, Getz G, Ligon KL, Palescandolo E, Van Hummelen P, Ducar MD, 2013. Genomic sequencing of meningiomas identifies oncogenic SMO and AKT1 mutations. Nat Genet 15: 285–289.
- ↵Brembeck FH, Opitz OG, Libermann TA, Rustgi AK. 2000. Dual function of the epithelial specific ets transcription factor, ELF3, in modulating differentiation. Oncogene 19: 1941–1949.
- ↵Brodeur GM, Seeger RC, Schwab M, Varmus HE, Bishop JM. 1984. Amplification of N-myc in untreated human neuroblastomas correlates with advanced disease stage. Science 224: 1121–1124.
- ↵Buczkowicz P, Hoeman C, Rakopoulos P, Pajovic S, Letourneau L, Dzamba M, Morrison A, Lewis P, Bouffet E, Bartels U, 2014. Genomic analysis of diffuse intrinsic pontine gliomas identifies three molecular subgroups and recurrent activating ACVR1 mutations. Nat Genet 46: 451–456.
- ↵Carrillo AM, Bouska A, Arrate MP, Eischen CM. 2014. Mdmx promotes genomic instability independent of p53 and Mdm2. Oncogene 34: 846–856.
- ↵Chen L, Gilkes DM, Pan Y, Lane WS, Chen J. 2005. ATM and Chk2-dependent phosphorylation of MDMX contribute to p53 activation after DNA damage. EMBO J 24: 3411–3422.
- ↵Chen K, Wallis JW, McLellan MD, Larson DE, Kalicki JM, Pohl CS, McGrath SD, Wendl MC, Zhang Q, Locke DP, 2009. BreakDancer: an algorithm for high-resolution mapping of genomic structural variation. Nat Methods 6: 677–681.
- ↵Cheng JM, Hiemstra JL, Schneider SS, Naumova A, Cheung NK, Cohn SL, Diller L, Sapienza C, Brodeur GM. 1993. Preferential amplification of the paternal allele of the N-myc gene in human neuroblastomas. Nat Genet 4: 191–194.
- ↵Chun TY. 1997. Coincidence of bladder and prostate cancer. J Urol 157: 65–67.
- ↵Dang CV. 2012. MYC on the path to cancer. Cell 149: 22–35.
- ↵Derrien T, Estellé J, Sola SM, Knowles DG, Raineri E, Guigó R, Ribeca P. 2012. Fast computation and applications of genome mappability. PLoS One 7: e30377.
- ↵Durbin R, Eddy S, Krogh A, Mitchison G. 1998. Biological sequence analysis: probabilistic models of proteins and nucleic acids. Cambridge University Press, New York.
- ↵Fontebasso AM, Papillon-Cavanagh S, Schwartzentruber J, Nikbakht H, Gerges N, Fiset P-O, Bechet D, Faury D, De Jay N, Ramkissoon LA, 2014. Recurrent somatic mutations in ACVR1 in pediatric midline high-grade astrocytoma. Nat Genet 46: 462–466.
- ↵Forment JV, Kaidi A, Jackson SP. 2012. Chromothripsis and cancer: causes and consequences of chromosome shattering. Nat Rev Cancer 12: 663–670.
- ↵Greenman CD, Pleasance ED, Newman S, Yang F, Fu B, Nik-Zainal S, Jones D, Lau KW, Carter N, Edwards PAW, 2012. Estimation of rearrangement phylogeny for cancer genomes. Genome Res 22: 346–361.
- ↵Hochbaum DS. 2004. Monotonizing linear programs with up to two nonzeroes per column. Oper Res Lett 32: 49–58.
- ↵Jiang Y, Wang Y, Brudno M. 2012. PRISM: pair-read informed split-read mapping for base-pair level detection of insertion, deletion and structural variants. Bioinformatics 28: 2576–2583.
- ↵Jin Y, Dai M-S, Lu SZ, Xu Y, Luo Z, Zhao Y, Lu H. 2006. 14-3-3γ binds to MDMX that is phosphorylated by UV-activated Chk1, resulting in p53 activation. EMBO J 25: 1207–1218.
- ↵Jones C, Baker SJ. 2014. Unique genetic and epigenetic mechanisms driving paediatric diffuse high-grade glioma. Nat Rev Cancer 14: 651–661.
- ↵Kloosterman WP, Guryev V, van Roosmalen M, Duran KJ, de Bruijn E, Bakker SCM, Letteboer T, van Nesselrooij B, Hochstenbach R, Poot M, et al. 2011. Chromothripsis as a mechanism driving complex de novo structural rearrangements in the germline. Hum Mol Genet 20: 1916–1924.
- ↵Korbel JO, Campbell PJ. 2013. Criteria for inference of chromothripsis in cancer genomes. Cell 152: 1226–1236.
- ↵L'Abbate A, Macchia G, D'Addabbo P, Lonoce A, Tolomeo D, Trombetta D, Kok K, Bartenhagen C, Whelan CW, Palumbo O, 2014. Genomic organization and evolution of double minutes/homogeneously staining regions with MYC amplification in human cancer. Nucleic Acids Res 42: 9131–9145.
- ↵Livak KJ, Schmittgen TD. 2001. Analysis of relative gene expression data using real-time quantitative PCR and the 2−ΔΔCT method. Methods 25: 402–408.
- ↵Maciejowski J, Li Y, Bosco N, Campbell PJ, de Lange T. 2015. Chromothripsis and kataegis induced by telomere crisis. Cell 163: 1641–1654.
- ↵Malhotra A, Lindberg M, Faust GG, Leibowitz ML, Clark RA, Layer RM, Quinlan AR, Hall IM. 2013. Breakpoint profiling of 64 cancer genomes reveals numerous complex rearrangements spawned by homology-independent mechanisms. Genome Res 23: 762–776.
- ↵Mardin BR, Drainas AP, Waszak SM, Weischenfeldt J, Isokane M, Stütz AM, Raeder B, Efthymiopoulos T, Buccitelli C, Segura-Wang M, et al. 2015. A cell-based model system links chromothripsis with hyperploidy. Mol Syst Biol 11: 828.
- ↵McPherson A, Wu C, Wyatt AW, Shah S, Collins C, Sahinalp SC. 2012. nFuse: discovery of complex genomic rearrangements in cancer using high-throughput sequencing. Genome Res 22: 2250–2261.
- ↵Medvedev P, Brudno M. 2009. Maximum likelihood genome assembly. J Comput Biol 16: 1101–1116.
- ↵Medvedev P, Stanciu M, Brudno M. 2009. Computational methods for discovering structural variation with next-generation sequencing. Nat Methods 6: S13–S20.
- ↵Medvedev P, Fiume M, Dzamba M, Smith T, Brudno M. 2010. Detecting copy number variation with mated short reads. Genome Res 20: 1613–1622.
- ↵Mehine M, Kaasinen E, Makinen N, Katainen R, Kampjarvi K, Pitkanen E, Heinonen HR, Butzow R, Kilpivaara O, Kuosmanen A, 2013. Characterization of uterine leiomyomas by whole-genome sequencing. N Engl J Med 369: 43–53.
- ↵Meyer N, Penn LZ. 2008. Reflecting on 25 years with MYC. Nat Rev Cancer 8: 976–990.
- ↵Oesper L, Ritz A, Aerni SJ, Drebin R, Raphael BJ. 2012. Reconstructing cancer genomes from paired-end sequencing data. BMC Bioinformatics 13: S10.
- ↵Rausch T, Zichner T, Schlattl A, Stütz AM, Benes V, Korbel JO. 2012a. DELLY: structural variant discovery by integrated paired-end and split-read analysis. Bioinformatics 28: i333–i339.
- ↵Rausch T, Jones DTW, Zapatka M, Stütz AM, Zichner T, Weischenfeldt J, Jäger N, Remke M, Shih D, Northcott PA, et al. 2012b. Genome sequencing of pediatric medulloblastoma links catastrophic DNA rearrangements with TP53 mutations. Cell 148: 59–71.
- ↵Sanborn JZ, Salama SR, Grifford M, Brennan CW, Mikkelsen T, Jhanwar S, Katzman S, Chin L, Haussler D. 2013. Double minute chromosomes in glioblastoma multiforme are revealed by precise reconstruction of oncogenic amplicons. Cancer Res 73: 6036–6045.
- ↵Seeger RC, Brodeur GM, Sather H, Dalton A, Siegel SE, Wong KY, Hammond D. 1985. Association of multiple copies of the N-myc oncogene with rapid progression of neuroblastomas. N Engl J Med 313: 1111–1116.
- ↵Shah N, Lankerovich M, Lee H, Yoon J-G, Schroeder B, Foltz G. 2013. Exploration of the gene fusion landscape of glioblastoma using transcriptome sequencing and copy number data. BMC Genomics 14: 818.
- ↵Stephens PJ, Greenman CD, Fu B, Yang F, Bignell GR, Mudie LJ, Pleasance ED, Lau KW, Beare D, Stebbings LA, 2011. Massive genomic rearrangement acquired in a single catastrophic event during cancer development. Cell 144: 27–40.
- ↵Taylor KR, Mackay A, Truffaux N, Butterfield YS, Morozova O, Philippe C, Castel D, Grasso CS, Vinci M, Carvalho D, 2014. Recurrent activating ACVR1 mutations in diffuse intrinsic pontine glioma. Nat Genet 46: 457–461.
- ↵Untergasser A, Cutcutache I, Koressaar T, Ye J, Faircloth BC, Remm M, Rozen SG. 2012. Primer3—new capabilities and interfaces. Nucleic Acids Res 40: e115.
- ↵Wang J, Mullighan CG, Easton J, Roberts S, Heatley SL, Ma J, Rusch MC, Chen K, Harris CC, Ding L, 2011. CREST maps somatic structural variation in cancer genomes with base-pair resolution. Nat Methods 8: 652–654.
- ↵Wu G, Diaz AK, Paugh BS, Rankin SL, Ju B, Li Y, Zhu X, Qu C, Chen X, Zhang J, 2014. The genomic landscape of diffuse intrinsic pontine glioma and pediatric non-brainstem high-grade glioma. Nat Genet 46: 444–450.
- ↵Zack TI, Schumacher SE, Carter SL, Cherniack AD, Saksena G, Tabak B, Lawrence MS, Zhang C-Z, Wala J, Mermel CH, 2013. Pan-cancer patterns of somatic copy number alteration. Nat Genet 45: 1134–1140.
- ↵Zhang CZ, Leibowitz ML, Pellman D. 2013. Chromothripsis and beyond: rapid genome evolution from complex chromosomal rearrangements. Genes Dev 27: 2513–2530.