
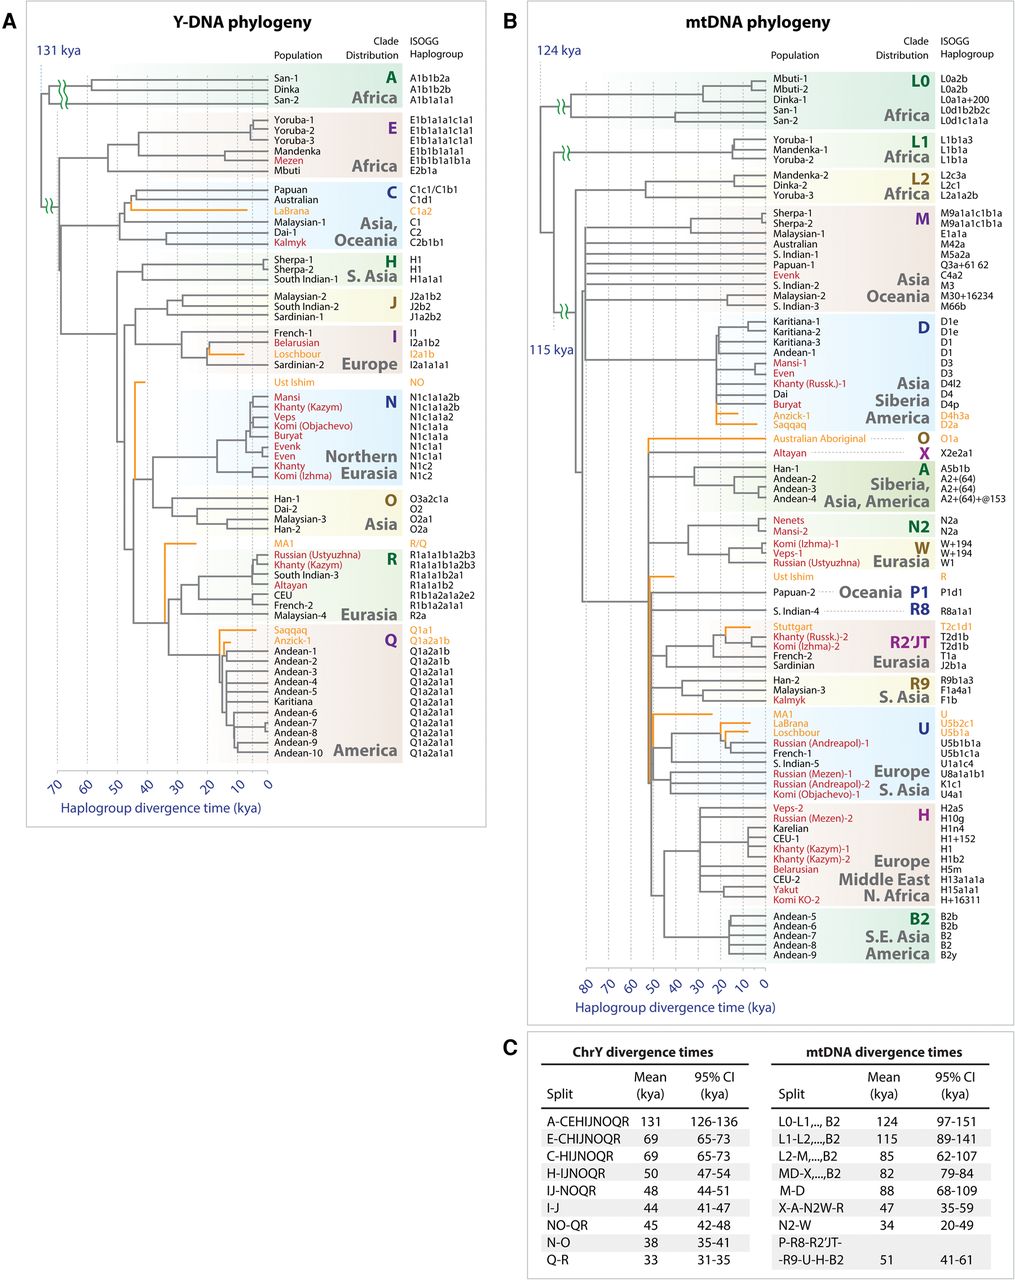
Y-Chromosome and mtDNA phylogeny and haplogroup divergence times. (A) Y-Chromosome tree topology was calculated using maximum likelihood approach implemented in MEGA tool (Tamura et al. 2011) using 12,394 polymorphic sites within high-confidence regions defined by Poznik et al. (2013). The x-axis represents divergence time of haplogroups and is expressed in units of thousands of years ago (1 kya = 1000 yr ago). The tree was constructed using the data from 54 modern-day humans from 30 populations. Split times were calculated according to the number of derived alleles assigned to each branch (Methods), and splits were placed along the x-axis to reflect haplotype divergence time. Terminal branches end at X = 0 for modern-day individuals. Seven ancient individuals were placed on the haplotype tree according to the SNP-sharing patterns with high-confidence–derived allele SNVs assigned to each branch. Branches of ancient individuals (orange lines) terminate at times when each ancient individual lived. Haplogroups were assigned based on ISOGG Y-Chromosome SNP index and shown along the right side of the tree (International Society of Genetic Genealogy 2014). Individuals sequenced as part of this work are shown in red. (B) mtDNA phylogeny was constructed using MEGA tool in a similar fashion to the Y-Chromosome tree. The tree includes data from 70 individuals and 34 populations, as well as eight ancient genomes. (C) Divergence times of haplogroups from Y-Chromosome phylogeny (left) and mtDNA phylogeny (right). Diverging clades are shown on the left sides (“Split” columns). Confidence intervals were calculated using Poisson model.


