
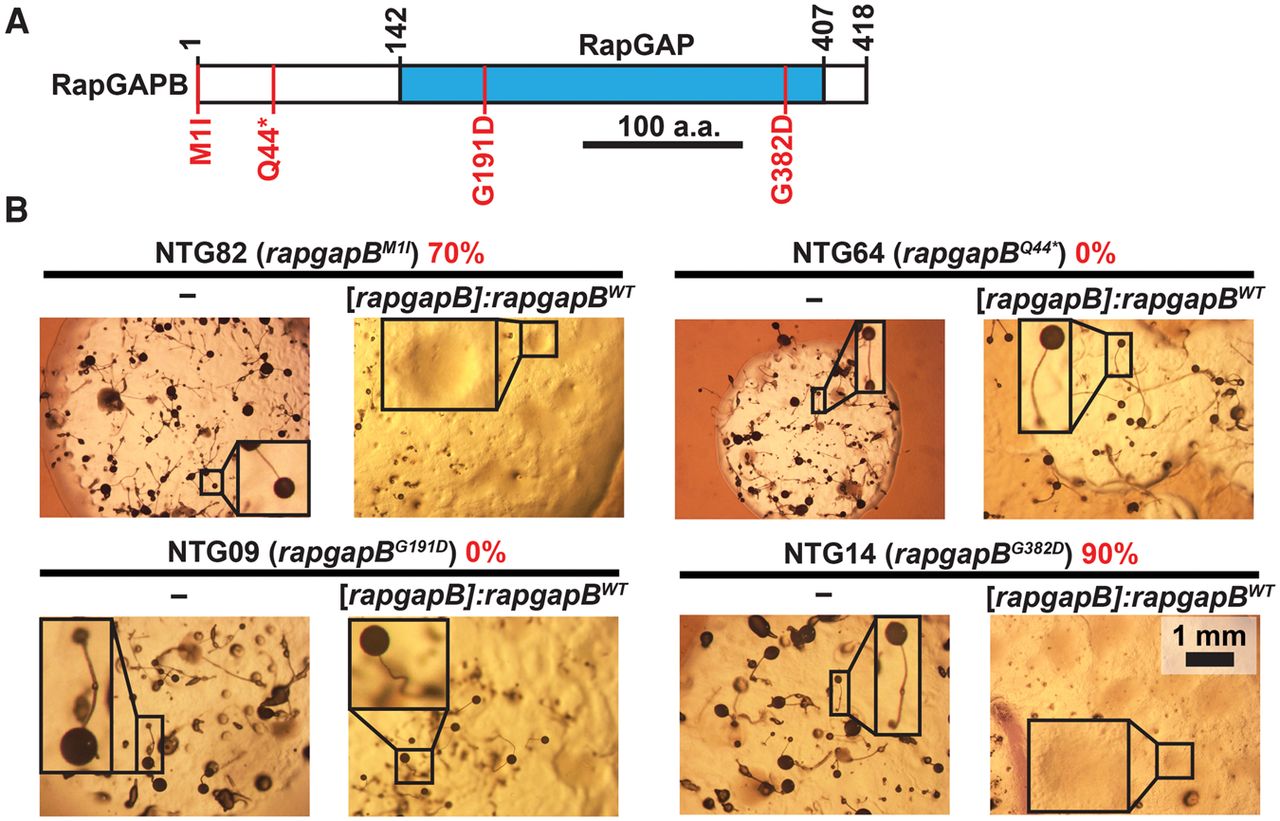
Recessive causative mutations in rapgapB observed in the screen for suppression of the tgrB1-C1 mismatch phenotype. (A) Schematic representation of RapGAPB. The blue rectangle indicates the Rap GTPase-activating protein (RapGAP) domain. Numbers above the chart represent amino acid positions. Scale bar = 100 aa. Four of the 17 amino acid substitutions observed in the screen are indicated in red (M1I, Q44*, G191D, and G382D). (B) We performed a complementation test by introducing the rapgapBWT allele driven by the endogenous promoter ([rapgapB]:rapgapBWT) into chemically mutagenized strains carrying the indicated rapgapB mutations. We grew the transformants in association with bacteria on nutrient agar and measured the proportion of colonies that lost the suppression phenotype (%, red text). We photographed the morphology of the mutants with or without the rapgapBWT expression construct, as indicated below the line of each panel. The names of the individual strains (NTG#) and the respective rapgapB mutations are indicated above the line in each panel. Insets are magnified (3×). Scale bar = 1 mm.


