
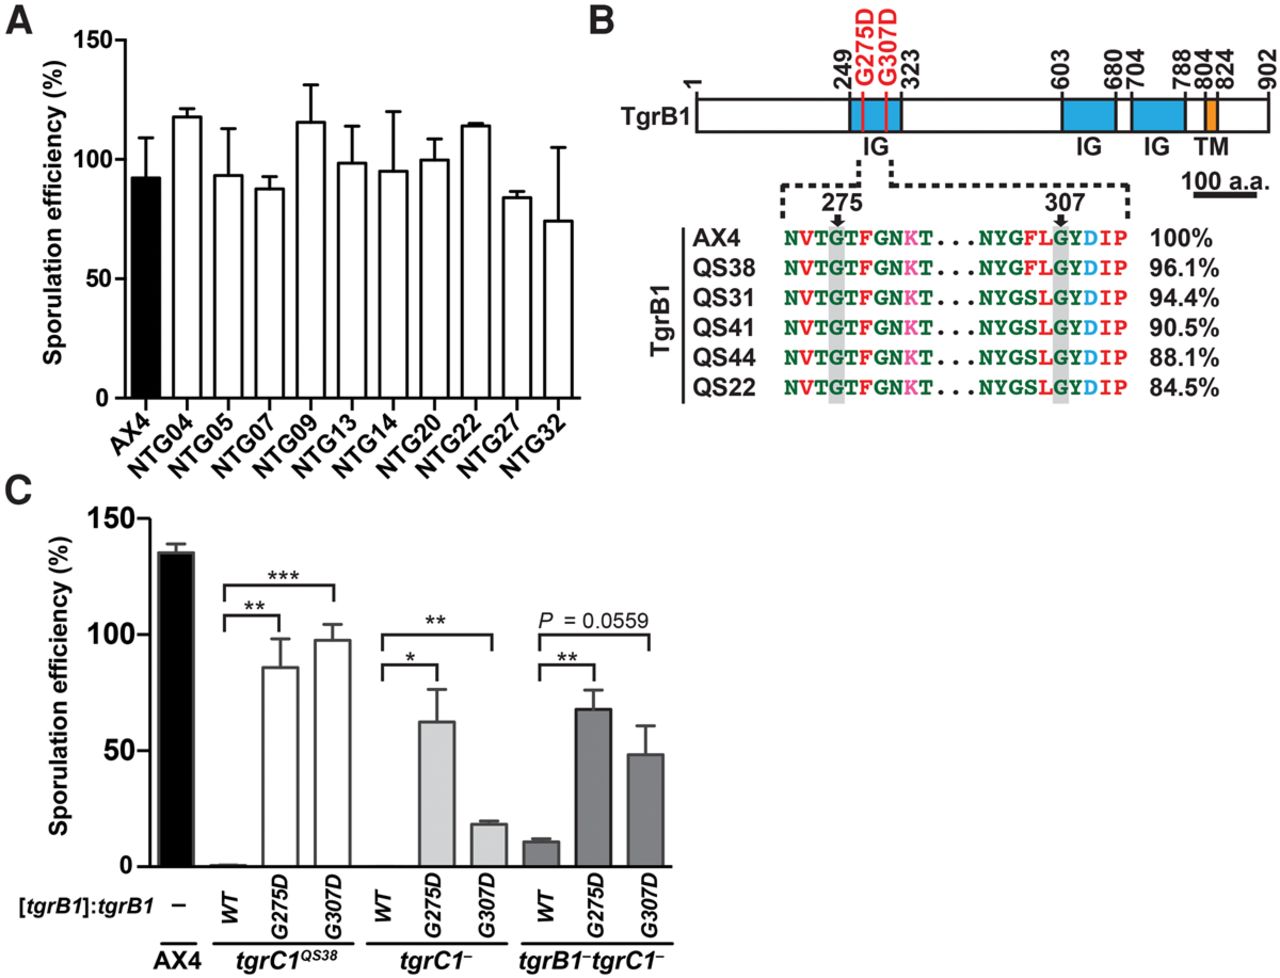
Dominant causative mutations in tgrB1 identified in the screen for suppression of the tgrB1-C1 mismatch phenotype. (A) We developed cells for 72 h on a nitrocellulose filter and counted the fraction (%) of cells that formed spores. Strain names are indicated under the x-axis: AX4 cells (black bar) and 10 NTG-mutagenized mutants (white bars) isolated from the screen for suppression of the tgrB1-C1 mismatch phenotype. The bar graph represents the mean ± standard deviation (SD) of three independent replicates. (B) (Top) TgrB1 contains three immunoglobulin-like domains (IG, blue) and one transmembrane domain (TM, orange). Numbers above the chart represent amino acid positions. Scale bar = 100 aa. Recurrent missense mutations (G275D and G307D) are indicated as red bars. (Bottom) Partial protein sequence alignment of the polymorphic tgrB1 alleles from AX4 and five wild isolates as indicated. The pairwise sequence identity (%) compared to TgrB1AX4 is indicated on the right. (C) We expressed three different alleles (tgrB1WT, tgrB1G275D, or tgrB1G307D, as indicated immediately below the x-axis) driven by the native promoter, in three tgrC1-defective mutants (tgrC1QS38, tgrC1−, and tgrB1−tgrC1−, as indicated on the bottom). We allowed the cells to develop and measured their sporulation efficiencies as the proportion of cells (%) that formed spores (y-axis). Bars represent the means ± SD of four independent replicates. Welch's unequal variances t-test (two-tailed): (*) P value < 0.05; (**) P value < 0.01; (***) P value < 0.005.


