
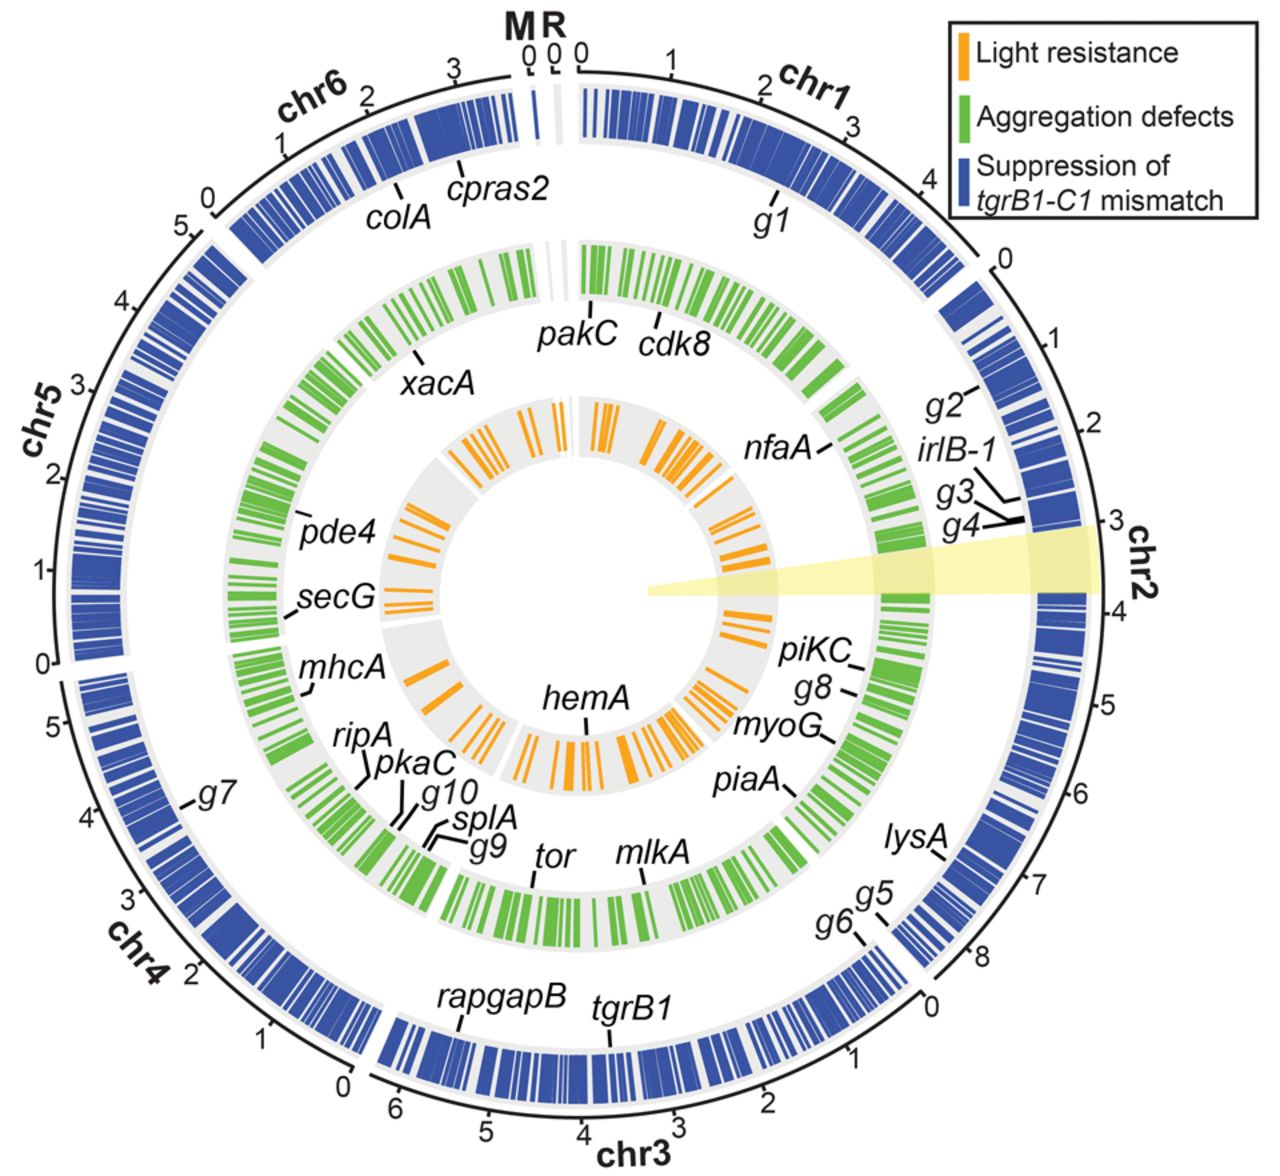
The genomic distribution of chemically induced mutations. The circular plot summarizes the distribution of chemically induced mutations in the six chromosomal (Chr 1–6), mitochondrial (M), and ribosomal (R) DNAs. Colored bars on the three concentric circles represent the mutations found in the three genetic screens as indicated in the legend: suppression of the tgrB1-C1 mismatch (blue, n = 63 strains), aggregation defects (green, n = 14 strains), and light resistance (orange, n = 6 strains). The candidate genes in the individual screens are labeled inside the respective circles, and the black lines indicate their chromosomal positions. Abbreviations: g1, DDB_G0270488; g2, DDB_G0271904; g3, DDB_G0273247; g4, DDB_G0273385; g5, DDB_G0277749; g6, DDB_G0277997; g7, DDB_G0285705; g8, DDB_G0275861; g9, DDB_G0283339; g10, DDB_G0283893. The yellow sector (around 3 o'clock) indicates the second copy of the Chromosome 2 duplication (Chr 2: 3016083…3768654), which was masked during the alignment of sequencing reads. The full list of mutations is detailed in Supplemental Data 1–3 and the candidate genes in Supplemental Table S1. The scale outside the circles shows positions in million base pairs (Mb).


