
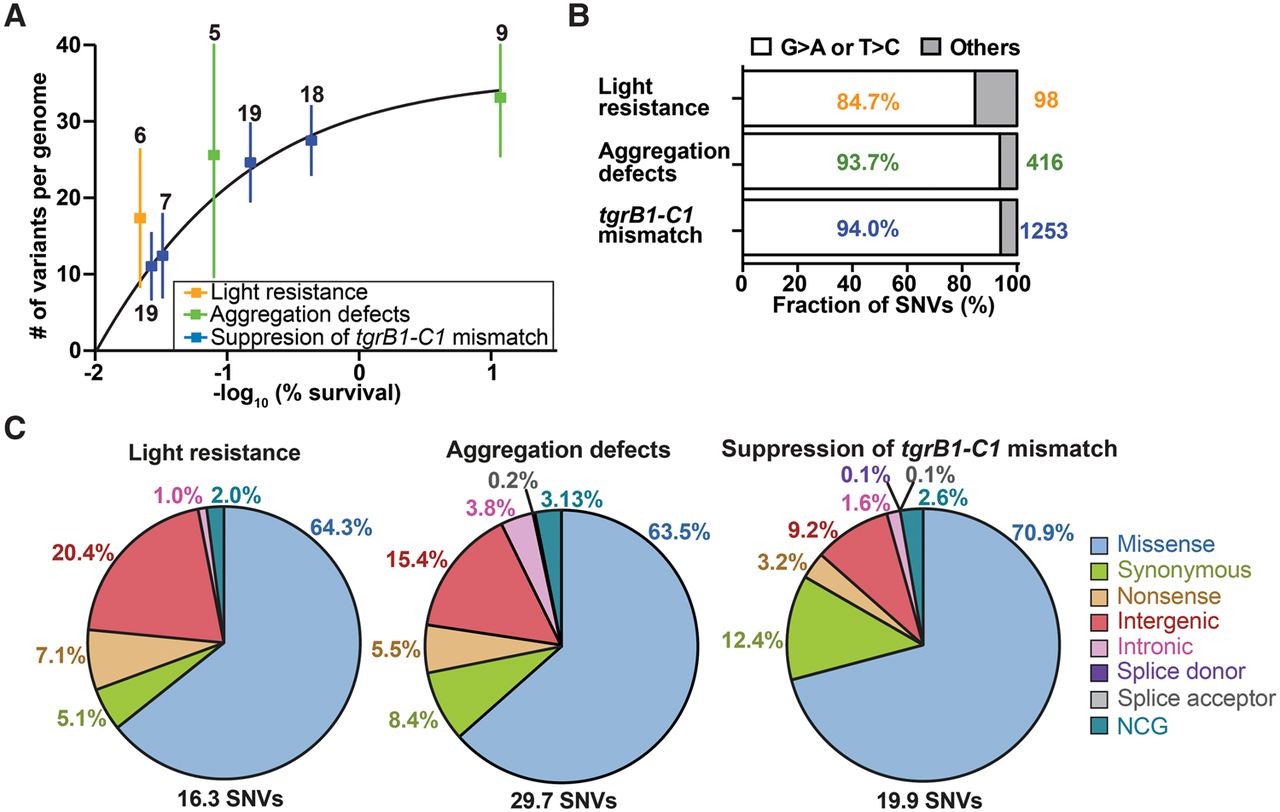
Properties of the chemically induced mutations. (A) We plotted the number of mutations (single nucleotide variants and indels) per genome (y-axis) against the negative logarithm of survival (%, x-axis). Dots represent means and whiskers represent 95% confidence intervals. Sample sizes are indicated next to each whisker, and the framed legend describes the experiments. (B) The bars show the proportion of filtered single nucleotide variants (SNVs) that are G > A or T > C transitions in individual experiments (white) and the other substitutions (gray). Percentages of G > A or T > C transitions are indicated inside the bars. The total numbers of filtered SNVs are indicated on the right. Sample size: light resistance (n = 6), aggregation defects (n = 14), and tgrB1-C1 mismatch (n = 63). (C) SNVs were classified into eight groups based on the locations and types of substitution mutations (missense, synonymous, nonsense, intergenic, intronic [excluding splice sites], splice donor site, splice acceptor site, and NCG [noncoding gene], as indicated on the right). Titles above the pie charts describe the experiments. The average number of SNVs per genome is indicated on the bottom. The percentages of individual mutation types are indicated next to individual sectors.


