
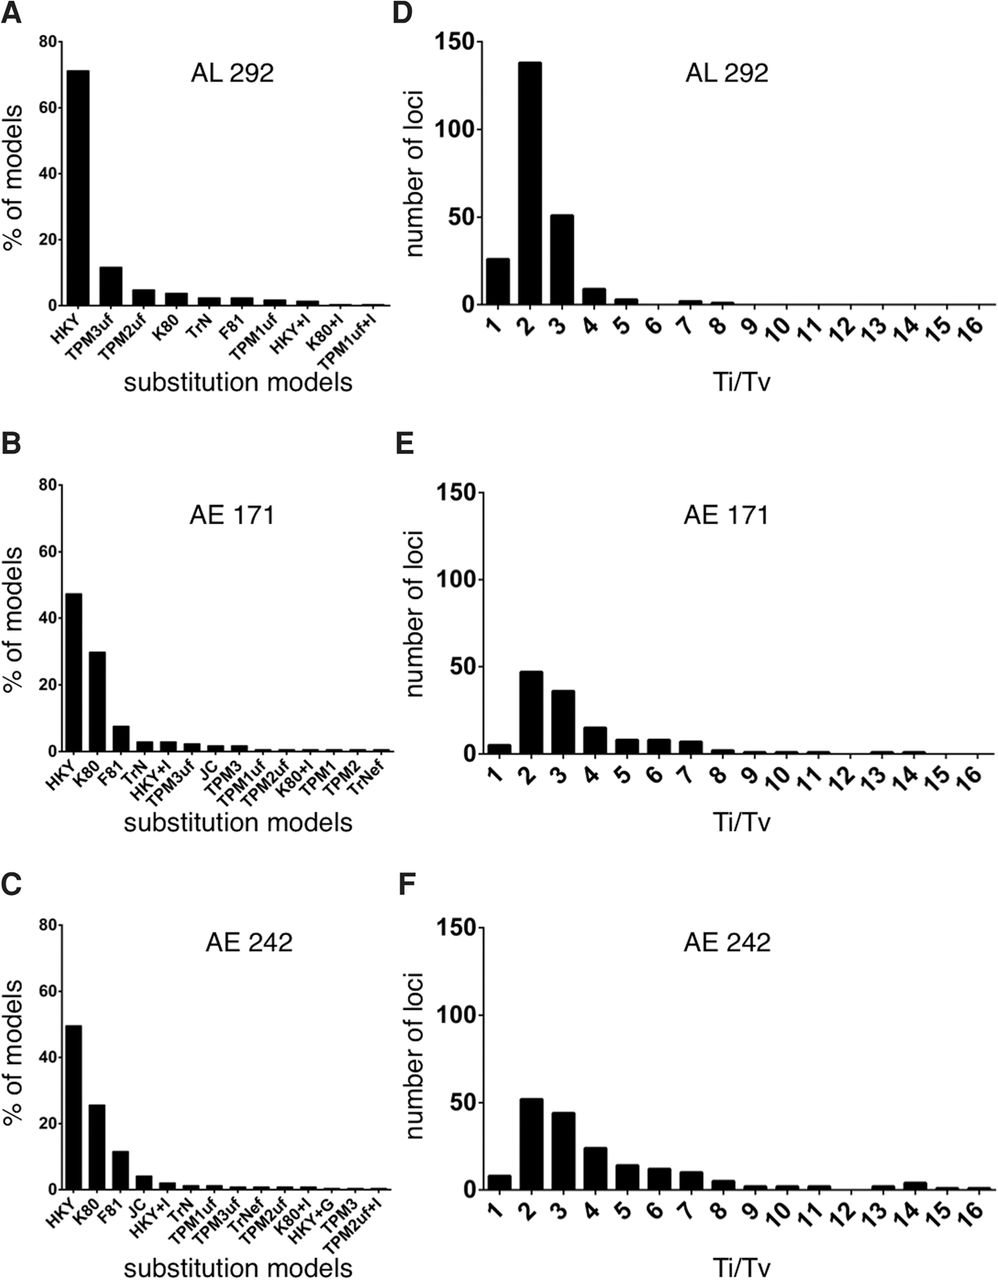
Mutational profiles observed in three phylogenomic data sets obtained from human, chimpanzee, gorilla, and orangutan genomes. The data sets include 292 AL, 171 anchored enrichment (AE) loci, and 242 AE loci (for descriptions of each data set, see main text). (A–C) Distributions of nucleotide substitution models for each data set (for details about the different models, see Posada 2008). (D–F) Distributions of transition/transversion (Ti/Tv) rate ratios for each data set. Note, Ti/Tv values are only shown for loci that had a best-fitting nucleotide substitution model containing this parameter (i.e., 185, 133, and 230 loci, respectively). Also, five of the 171 AE loci and six of the 242 AE loci exhibited unusually high Ti/Tv values and thus were not included in these analyses. Source data are in Supplemental Tables S3 through S5.


