
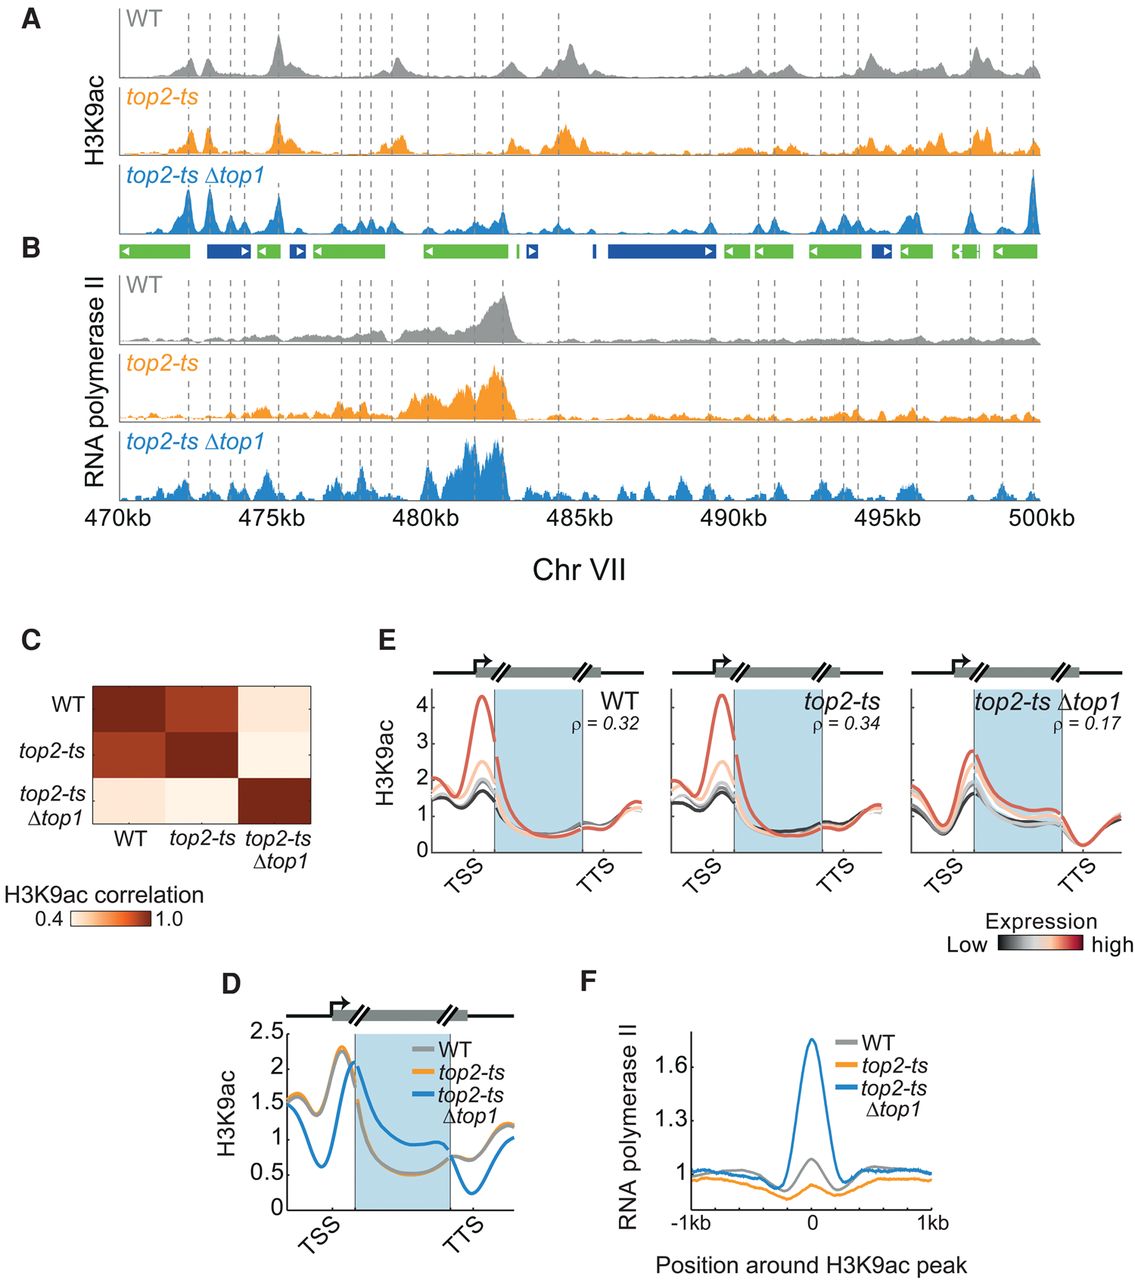
Replication-independent effects of topoisomerase depletion on H3K9ac and RNA polymerase II. (A,B) Colocalization of RNA polymerase II with replication-independent H3K9ac peaks. H3K9ac levels (A) and RNA pol II binding (B) in synchronized cells. Dashed lines highlight peaks of H3K9ac in the top2-tsΔtop1 strain. Gene positions are depicted in the center, as in Figure 6C (inset). (C) Topoisomerase depletion modifies the genome-wide H3K9ac pattern. The genome-wide correlations between H3K9ac in synchronized cells of the indicated strains. (D) Shift in H3K9ac upon depletion of topoisomerases. Metagene analysis of H3K9ac (as in Fig. 1C) for the indicated strains. (E) Shift in H3K9ac is associated with gene expression levels. Metagene analysis of H3K9ac for genes grouped according to their expression levels (as in Fig. 5B). Expression levels as measured in the relevant strain at the synchronized time-point. Correlation values (ρ) between gene average H3K9ac and gene expression levels are indicated. (F) H3K9ac colocalizes with RNA pol II. Peaks in H3K9ac were identified, the respective regions were aligned by the maximal H3K9ac signal, and the average RNA pol II measured over the aligned regions was plotted.


