
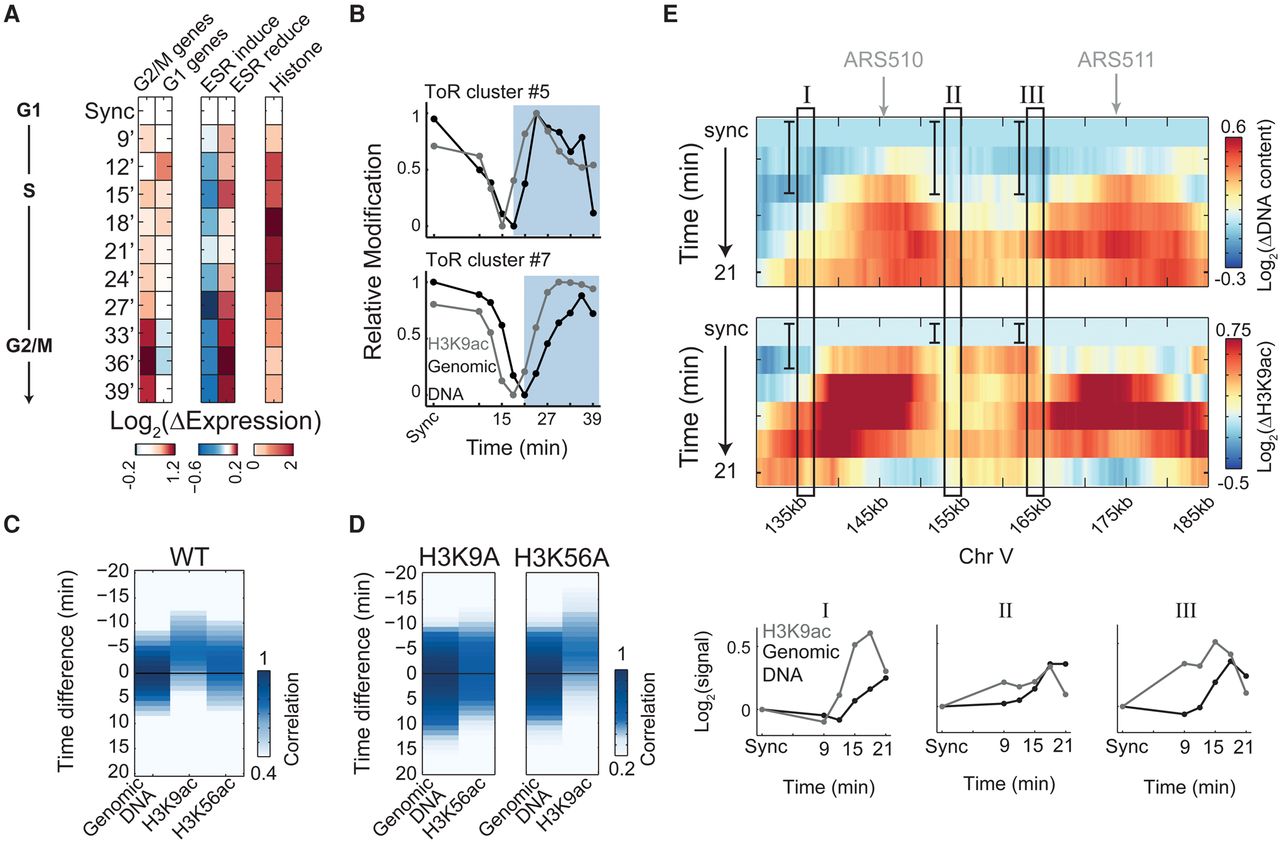
H3K9 acetylation precedes replication. (A) Experimental scheme and gene expression. Cells were released from α-factor G1-arrest and sampled every 3 min for DNA staining, RNA-seq, and ChIP-seq of H3K9ac and H3K56ac. Gene expression changes are shown, as in Figure 1B. (B) Prereplication increase in H3K9ac. Same as Figure 2A for the indicated clusters (see more clusters in Supplemental Fig. S8C). (C,D) H3K9ac precedes DNA replication. Cross-correlation analysis as in Figure 2B, for H3K9ac and H3K56ac in wild-type cells (C), and in cells carrying the H3K9A or H3K56A histone variants (D). See replication progression in Supplemental Figure S8, F through H. (E) Prereplication increase in H3K9ac along 55 kb of chromosome V. Same as Figure 1F for wild-type cells released from α-factor synchronization. Data were normalized by the synchronized time-point and were plotted up to 21 min (for the full time-course, see Supplemental Fig. S8D). Autonomously replicating regions (ARSs) are indicated (top). Three 2-kb regions (I–III, marked by rectangles) were averaged for both H3K9ac and DNA content in each time-point and plotted together for comparison.


